
NZD/USD Clears 2020 High To Push RSI Towards Overbought Territory
Key market trends may keep NZD/USD afloat as the US Dollar still reflects an inverse relationship with investor confidence, and swings in risk appetite may continue to sway the exchange rate as long as the Federal Reserve remains committed to increasing its “holdings of Treasury securities by at least $80 billion per month and of agency mortgage-backed securities by at least $40 billion per month”.
(Click on image to enlarge)
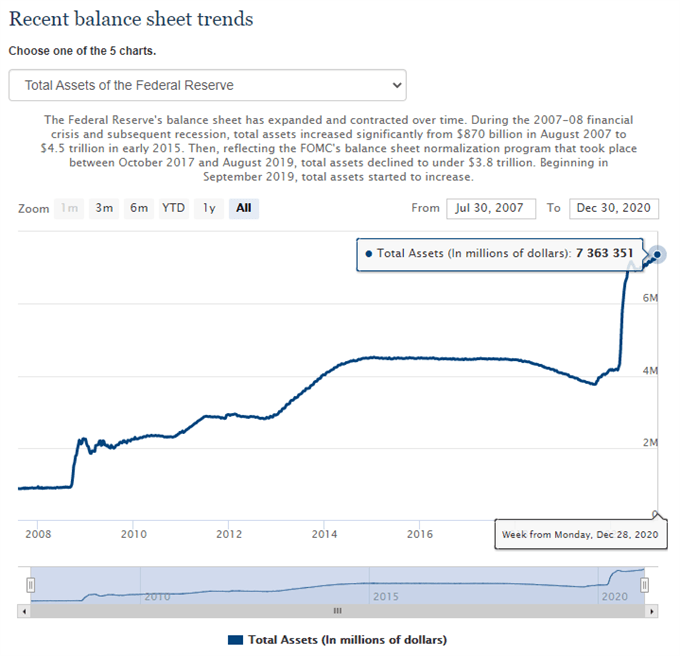
Source: FOMC
In turn, the recent pullback in the Fed’s balance sheet may end up being short-lived as the latest update showed the figure narrowing to $7.363 trillion in the week of December 28 from a record high of $7.404 trillion the week prior, and the ongoing response to the COVID-19 pandemic is likely to keep key market trends in place as monetary authorities become increasingly reliant on their non-standard tools to achieve their policy targets.
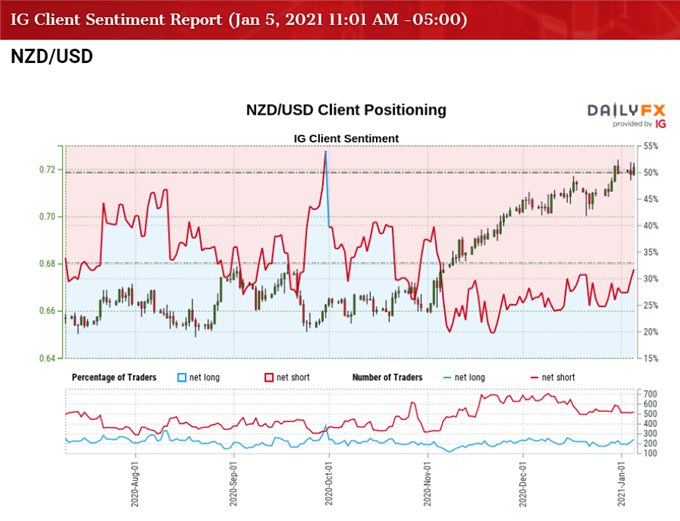
At the same time, the tilt in retail sentiment also looks poised to persist as the crowding behavior from the first half of 2020 resurfaces, with the IG Client Sentiment report showing 30.28% of traders net-long NZD/USD as the ratio of traders short to long stands at 2.30 to 1.
The number of traders net-long is 0.82% lower than yesterday and 14.22% higher from last week, while the number of traders net-short is 4.13% higher than yesterday and 0.73% higher from last week. The rise in net-long interest has helped to alleviate the tilt in retail sentiment as only 29.34% of traders were net-long NZD/USD in mid- December, but the rise in net-short interest suggests the crowding behavior will persist even though the exchange rate clears the 2020 high (0.7241) during the opening week of January.
With that said, key market trends may keep NZD/USD afloat as the US Dollar still reflects an inverse relationship with investor confidence, and the exchange rate may continue to exhibit a bullish behavior as the Relative Strength Index (RSI) flirts with overbought territory.
NZD/USD RATE DAILY CHART
(Click on image to enlarge)
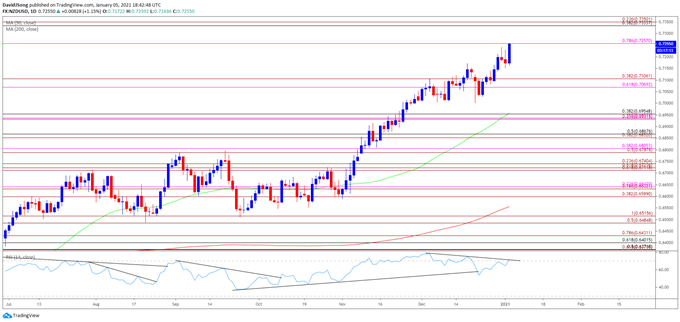
Source: Trading View
- Keep in mind, NZD/USD cleared the February high (0.6503) in June as the Relative Strength Index (RSI) broke above 70 for the first time in 2020, with the exchange rate taking out the January high (0.6733) in September following the close above the Fibonacci overlap around 0.6710 (61.8% expansion) to 0.6740 (23.6% expansion).
- However, lack of momentum to close above the 0.6790 (50% expansion) region pushed NZD/USD below the Fibonacci overlap around 0.6600 (38.2% expansion) to 0.6630 (78.6% expansion), with the RSI slipping to its lowest level since April during the same period.
- NZD/USD appeared to be on track to test the August low (0.6489) as the RSI established a downward trend in September, but the decline from the September high (0.6798)turned out to be an exhaustion in the bullish trend rather than a change in NZD/USD behavior as the 0.6490 (50% expansion) to 0.6520 (100% expansion) region provided support.
- The RSI highlighted a similar dynamic as it reverses course ahead of oversold territory to break out of the bearish formation from September, with the oscillator establishing an upward trend in October.
- Lack of momentum to test the August low (0.6489) pushed NZD/USD back above the 0.6600 (38.2% expansion) to 0.6630 (78.6% expansion) region, with the exchange rate clearing the September high (0.6798) in November, which pushed the RSI into overbought territory for the first time since June.
- NZD/USD also cleared the June 2018 high (0.7060) as it climbed to a fresh yearly highs in December, with the exchange rate taking out the 2020 high (0.7241) during the first week of January to come up against the 0.7260 (78.6% expansion) region.
- Looming developments in the RSI may show the bullish momentum gathering pace as the oscillator flirts with overbought territory, but still need a close above the 0.7260 (78.6% expansion) region to bring the Fibonacci overlap around 0.7330 (38.2% retracement) to 0.7350 (23.6% expansion) on the radar.
Disclosure: See the full disclosure for DailyFX here.


