
November Core Inflation And Impact On Fed Guidance, Yield Curve
The Fed is being pushed in the dovish direction by markets as the stock market is falling and the yield curve is flattening. The problem is the latest inflation reports, which we will review in this article, may encourage the Fed to keep hiking rates because core inflation is stubbornly strong. Some inexperienced traders question why the Fed always inverts the yield curve at the end of the business cycle.
The Fed hikes rates to combat higher end of cycle inflation which slows the economic expansion. The decline in oil prices pushed headline inflation lower, but the Fed sets policy mainly based on core inflation, which excludes oil, so this won’t affect policy. To be clear, it helps workers because their real wage growth is stronger when headline inflation falls. However, with continued rate hikes, the labor market cycle will eventually turn in a negative direction. The yield curve suggests the chance of a recession is increasing.
Strong Core PPI-FD
We introduced the classic predicament the Fed faces at the end of all cycles. Now let’s fill in the details by discussing the November PPI and CPI reports. Headline PPI was 0.1% month over month and 2.5% year over year. Monthly inflation beat estimates for no change and yearly inflation fell from 2.9% in October. Oil prices fell 22% which put headline inflation in the unusual situation of being below core inflation. Without food and energy, monthly inflation was 0.3% and yearly inflation increased from 2.6% to 2.7%. Energy prices fell 5% monthly and rose 2.9% yearly. Food prices were up 1.3% monthly and up 0.4% yearly.
Core inflation, which also excludes transportation, was up 0.3% monthly and stable at a 2.8% increase yearly. Trade services and overall services were up 0.3% monthly and trade services were up 2.2% yearly. The Fed will interpret this report as support for the argument that it needs to keep hiking rates because core inflation is strong.
Core CPI Accelerates
The November CPI report was similar to the PPI report. Headline month over month inflation met estimates for no change. Yearly headline inflation fell from 2.5% to 2.2% because of the decline in oil prices. Energy prices and gas prices were down 2.2% and 4.2% monthly. As you can see from the chart below, core inflation contributed a high percentage of headline CPI.
(Click on image to enlarge)

Source: Oxford Economics
Core inflation was 0.2% monthly and 2.2% yearly. This is above the Fed’s target of 2% core inflation. The good news for next year is the comparisons will get tougher. However, if the Fed raised rates in 2017 when core inflation plummeted, it will probably raise them with core inflation above its target.
Specifically, the November core CPI reading increased from 2.15% to 2.24%. In 2017, it decreased from 1.77% to 1.71%. This means the 2-year stack increased from 3.92% to 3.95%. Core inflation increased the next 8 months in a row following the November 2017 comparison, which means the 2-year stack can increase more than it did this month, while year over year growth falls.
The Fed believes the next rate hike in December will only get it to the low end of the range of the estimates of the neutral rate. It doesn’t believe further hikes in 2019 is hawkish policy because it looks at the neutral rate rather than the yield curve as a guide.
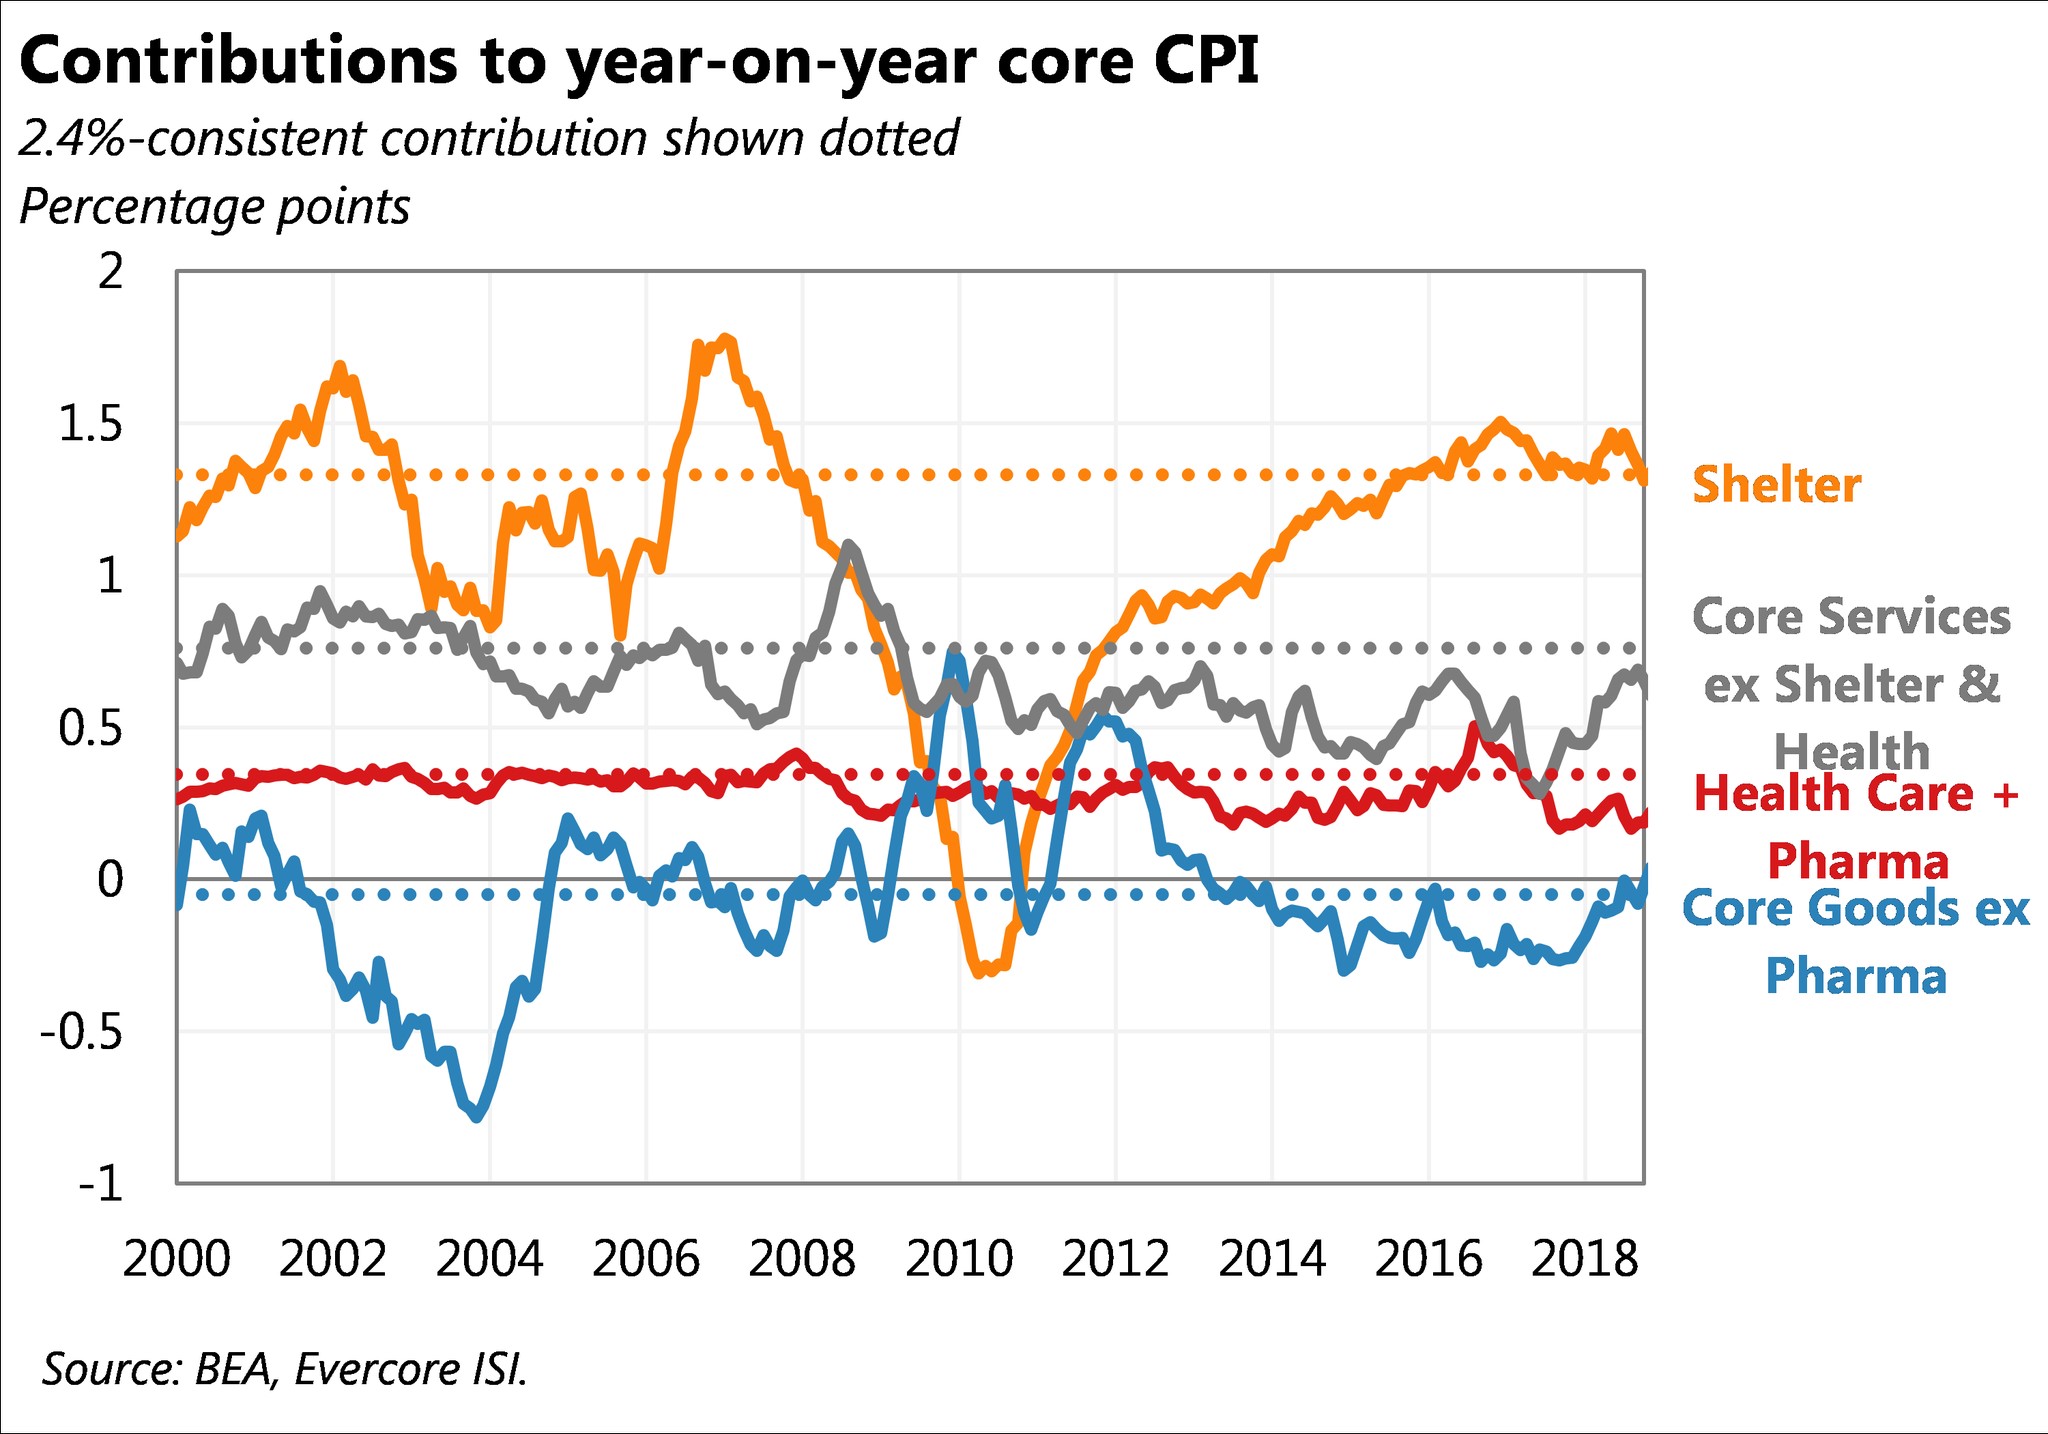
Specifics Of CPI Growth
Let’s look at the components of core CPI since it is a huge part of Fed policy. Apparel, transportation, and education/communications prices fell 0.9%, 0.8%, and 0.5% monthly. Housing and medical care prices drove inflation as they increased by 0.3% and 0.4% monthly. The weakness in the housing market this year hasn’t affected shelter inflation enough to push down core CPI. The chart below shows the change each component needs to have for core CPI to increase by 2.4%. Shelter’s contribution stopped accelerating, but it hasn’t fallen much.
(Click on image to enlarge)
Fed Believes Inflation Could Increase
The Fed worries that wage growth will drive core inflation higher. Therefore, the strong core inflation and the tight labor market heading into the Fed’s December 19th meeting push it in the hawkish direction. Core inflation doesn’t have time to fall next year for the Fed to change its guidance because hawkish guidance next week could be enough to invert the curve. To be clear, the Fed looks at the November NFIB small business report, which says firms are prepared to raise wages, and the chart below shows that the average hourly wage growth for retail trade workers is the highest of this cycle.
(Click on image to enlarge)
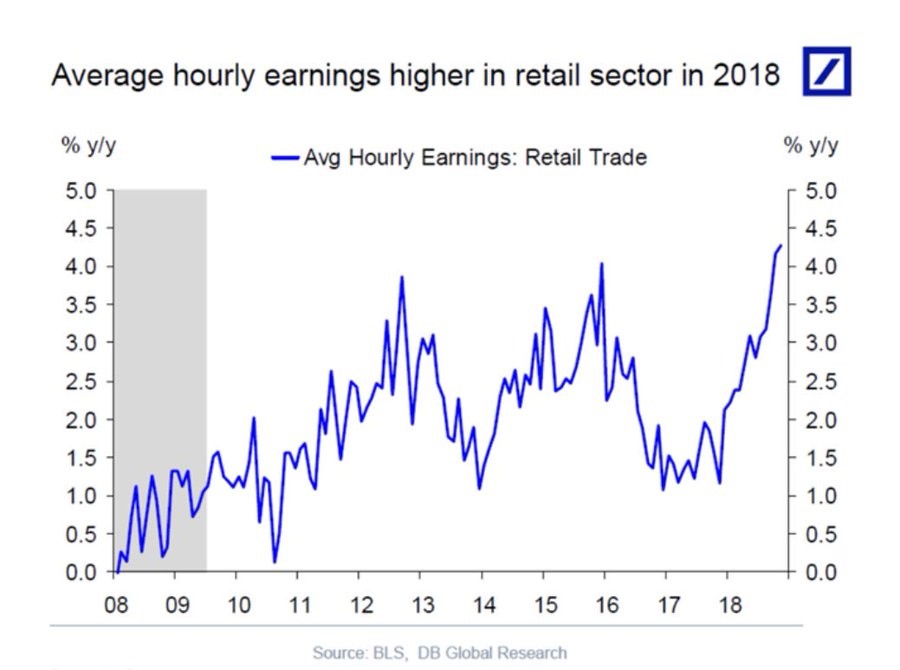
Source: Deutsche Bank
The labor market is tight, thus encouraging the Fed to hike rates into an economic slowdown which could cause a recession.
Oil Rally Coming?
The positive part of the inflation story for stock market bulls is core inflation faces tougher comparisons. The negative is current inflation is occurring with a strong dollar. If the Fed slows its rate hikes, that could weaken the dollar index which would increase commodities prices in dollar terms. There is a correlation between the yield curve in relation to other nations and the dollar index. Specifically, it has been bad for the dollar when the curve is relatively flat compared to other countries. That makes sense because it means the Fed needs to cut rates in relation to other countries.
If the scenario where the Fed is the most hawkish major central bank is over, it will hurt the dollar and help commodities. Oil prices pushed down headline inflation in November. However, the oil price decline might be over soon. As the chart below shows, global oil inventory has gone from a huge surplus to a small deficit.
(Click on image to enlarge)
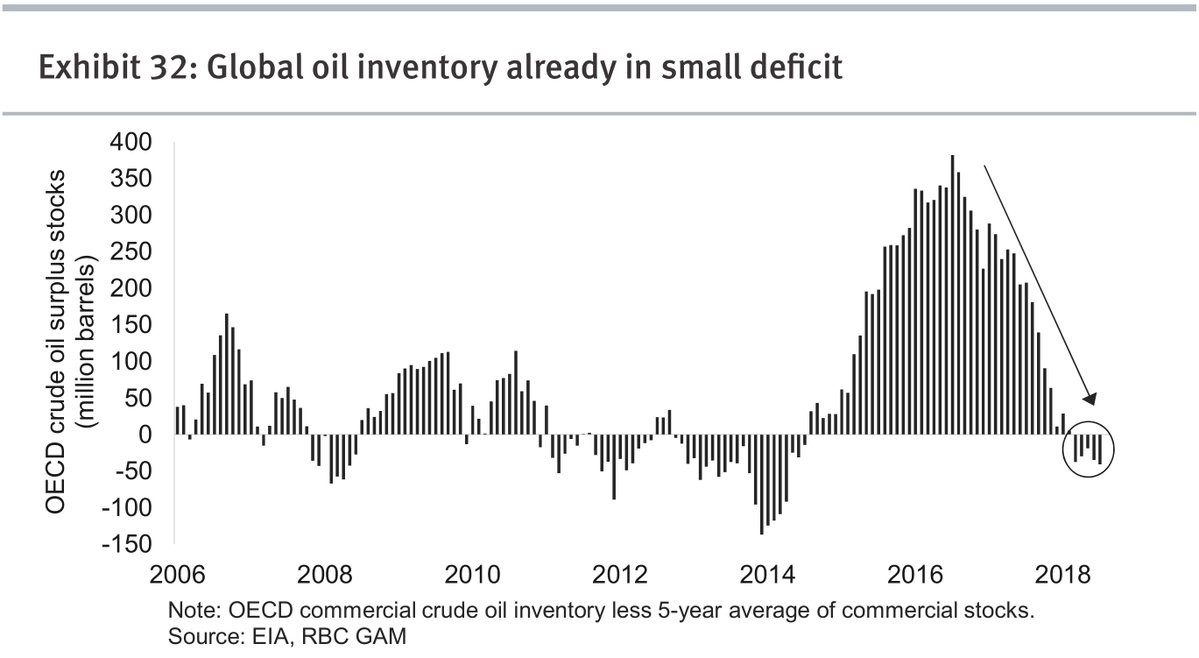
Source: RBC Global Asset Management
Why 2019 Guidance Matters Now
The Fed might not follow through on its 2019 guidance. It has switched guidance in the middle of the year before. However, this meeting’s guidance is pivotal because the yield curve is near an inversion. The chart below shows that when the 10-year yield and the 2-year yield are the same, there is a 91.9% chance of a recession.
(Click on image to enlarge)
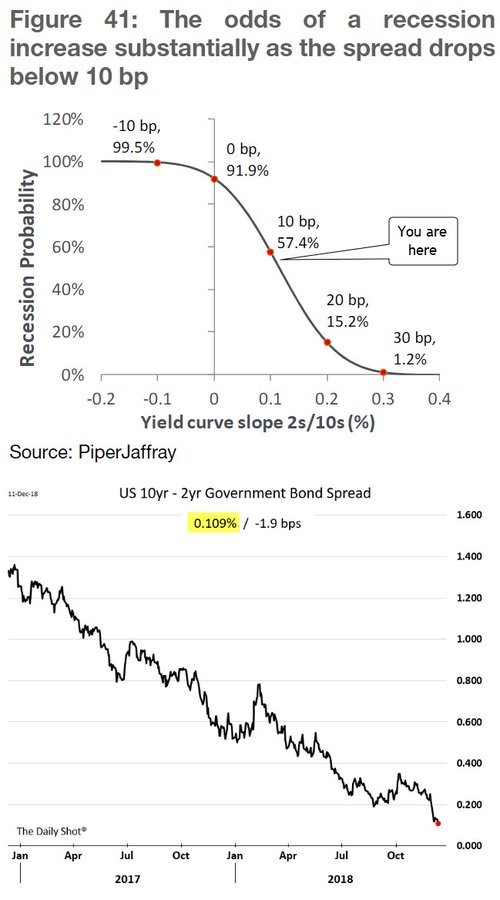
Source: Piper Jaffray
Each basis point matters. This chart shows the difference is 11 basis points. The latest update is 15 basis points. A hawkish dot plot could cause an inversion this year.
Conclusion
The latest core inflation reports suggest the Fed will keep hiking rates. The Fed also looks at the accelerating wage growth and the low unemployment rate to justify rate hikes. If the Fed is hawkish at its December 19th meeting, it could invert the curve which means there will probably be a recession in 1-2 years.
Disclaimer: Please familiarize yourself with our full disclaimer here.


