
November 2018 Import And Export Price Year-Over-Year Inflation Significant Moderation
Year-over-year import prices and export prices declined significantly more than expected.

Analyst Opinion of the Import / Export Price Situation
The month-over-month price index for fuel imports decreased (and non-fuel imports also marginally declined) - and the price index for agricultural exports marginally increased.
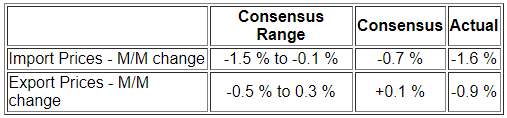
Import Oil prices were down 11.0 % month-over-month, and export agricultural prices were up 1.8 %.
- with import prices up 0.7 % year-over-year;
- and export prices up 1.8 % year-over-year;
- the markets were expecting (from Econoday):
There is only a marginal correlation between economic activity, recessions, and export/import prices. Prices can be rising or falling going into a recession or entering a period of expansion. Econintersect follows this data series to adjust economic activity for the effects of inflation where there are clear relationships.
Econintersect follows this series to adjust data for inflation.
Year-over-Year Change - Import Prices (blue line) and Export Prices (red line)
(Click on image to enlarge)

There are three cases of deflation outside of a recession - the early 1990s, late 1990s, and mid-2000s. Import price deflation is normally associated with the strengthening of the dollar relative to other currencies.
According to the press release:
All Imports:Prices for U.S. imports decreased 1.6 percent in November, the largest monthly decline since a 1.8-percent drop in August 2015. Despite the November drop, import prices increased 0.7 percent over the past 12 months, the smallest over-the-year advance since the index increased 0.2 percent from November 2015 to November 2016. (See table 1.) Fuel Imports: Import fuel prices decreased 11.0 percent in November following a 3.2-percent rise the previous month. The November drop was the largest 1-month decline since the index fell 15.6 percent in January 2016. A 12.1-percent decrease in petroleum prices led the November decline in fuel prices and was the largest monthly drop since petroleum prices fell 17.2 percent in January 2016. The November decline in petroleum prices more than offset a 12.8-percent advance in natural gas prices that followed a 22.3-percent increase for that index in October. Despite the decrease in November, fuel prices rose 4.6 percent over the past year. The price index for petroleum increased 4.4 percent for the year ended in November, and natural gas prices advanced 11.6 percent over the same period.
All Exports: Prices for U.S. exports declined 0.9 percent in November, the largest 1-month decrease since the index fell 0.9 percent in January 2016 and 1.1 percent in December 2015. Lower nonagricultural prices in November more than offset rising agricultural prices. Despite the November decline, U.S. export prices increased 1.8 percent over the past year. (See table 2.) Agricultural Exports: The price index for agricultural exports rose 1.8 percent in November, after falling 0.2 percent in October and 1.2 percent in September. The November advance was the largest increase since the index rose 3.2 percent in March. Higher prices for fruit, soybeans, and corn all contributed to the November increase in agricultural prices. Despite the November increase, agricultural export prices declined 1.7 percent from November 2017 to November 2018. A 10.7-percent drop in soybeans prices and a 12.3- percent decline in nut prices over the past year were the primary factors for the decrease in overall agricultural prices. All Exports Excluding Agriculture: Nonagricultural export prices fell 1.0 percent in November following a 0.5-percent increase the previous month and a 0.2-percent advance in September. The November drop was the largest monthly decrease since the index declined 1.1 percent in December 2015. Lower nonagricultural industrial supplies and materials prices led the November decrease in nonagricultural export prices, with falling prices for consumer goods and automotive vehicles also contributing to the decline. Despite the decline in November, prices for nonagricultural exports increased 2.2 percent over the past 12 months.
Month-over-Month Change - Import Prices (blue line) and Export Prices (red line)
(Click on image to enlarge)

The biggest mover of import and export prices are usually oil (imports) and agricultural products (exports).
Oil Import Price Change Month-over-Month (blue line) and Agriculture Export Change Month-over-Month (red line)
(Click on image to enlarge)

Caveats on the Use of the Export / Import Price Index
Both import and export prices index values shown in this post is a weighted average for the entire category of exports or imports. The BLS has many sub-categories relating to a particular commodity or goods. Econintersect using spot checks believes these subindexes are accurate.
Disclaimer: No content is to be construed as investment advise and all content is provided for informational purposes only.The reader is solely responsible for determining whether any investment, ...
more

