
"Normal" Valuations As US Election Approaches
The numbers have decreased - slightly - since we published our valuation study in August - when the overvaluation was at 48.83%. Since August, we have seen some fluctuations -and even a day where we were up above 50% overvaluation -but not much change.
Once more we find that the Brexit "panic" was overblown and the US markets have shaken that off quite well. Think about some of the more ridiculous hysteria from certain financial and political pundits at that time. We saw some calls to dump all stocks, "BUY GUNS, BUY SEEDS, BUY GOLD"--as usual - once again. NOT the best tactic for your portfolio and long-term financial health00as we can now see three months later.
The markets called the recent (non) Fed move perfectly. No rate increase for now, but “signals” indicating that the central bank would like to raise rates at least once more in the waning days of 2016. We still think that is a bad idea and that until we have strong signs that the labor market has recovered from the Bush recession and wages are well on the way to recovery it makes no sense to raise rates.
The Fed noted that “the Committee judges that the case for an increase in the federal funds rate has strengthened but decided, for the time being, to wait for further evidence of continued progress toward its objectives." Of course, those objectives are to maintain a sensible level of inflation (2% currently) and support “full employment” (which was historically set at @5%.) Regardless, 2016 looks highly unlikely to see rates in excess of 0.5 and 0.75%.
Our valuations show that the market is not overheated--and even when the indices flirt with record territory they barely spike above 50% overvalued. From their perspective, there is still room to run here given current price levels and earnings for many of our equities.
Keep in mind though that a Trump victory in November has the potential to wreak havoc on the markets due to the shock and uncertainty. That is the next moment of unknown outcomes that could unsettle investors and shake up global asset flows.
A candidate who has stated that "debt was sort of always interesting to me. Now we're in a different situation with the country. But I would borrow, knowing that if the economy crashed, you could make a deal. And if the economy was good, it was good. So, therefore, you can't lose. It's like, you know, you make a deal before you go into a poker game, and your odds are so much better" does not sound like a candidate totally devoted to the "full faith and credit" of the United States.
In the event of an unlikely - as of this writing -Trump victory in November, those sorts of sentiments and public statements are sure to give investors pause and may challenge the US status as the preferred currency across the globe. Currently, polling and political futures markets indicate that this is an unlikely November "surprise," but we should be wary of the potential fallout.
For now, our valuation figures once again indicate a "normal" market, with valuations that remain almost exactly in the middle of our scale.
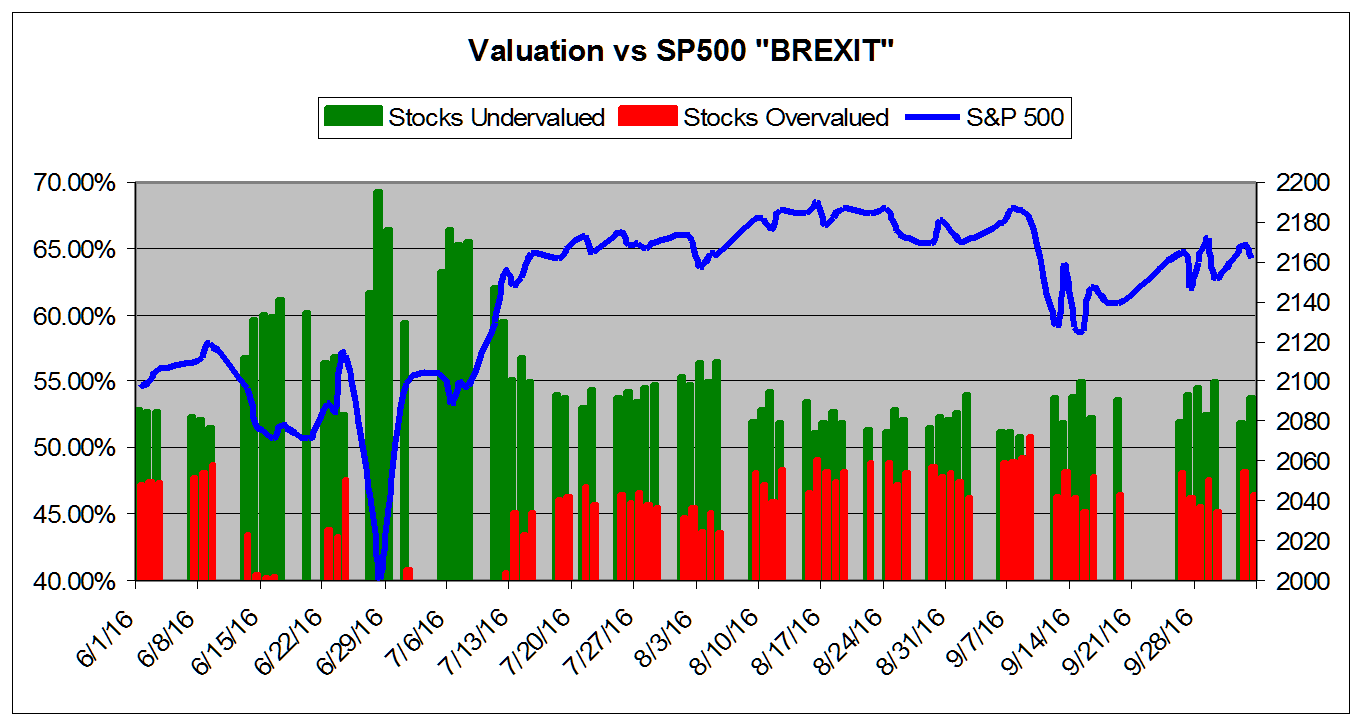
The chart below tracks the valuation metrics so far this Summer. It encompasses the Brexit sell-off. It shows levels in excess of 40%.
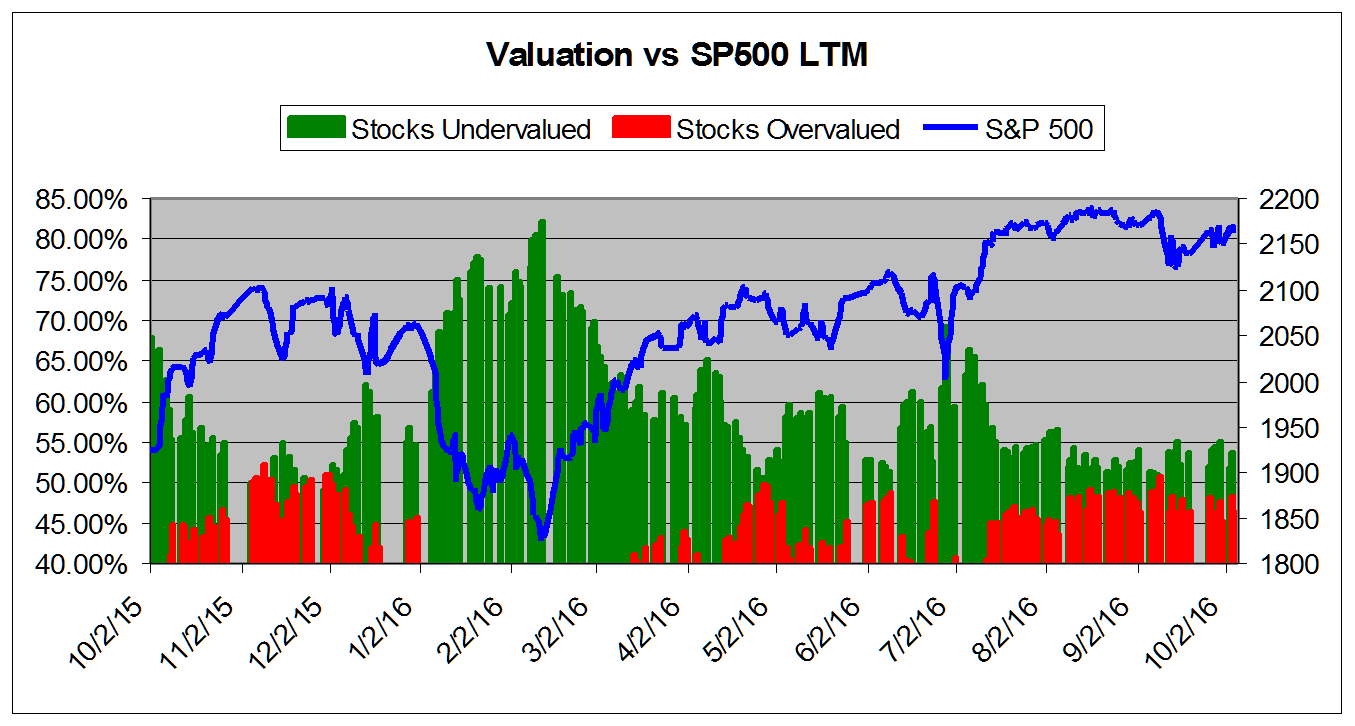
The chart below tracks the valuation metrics from August 2015. It shows levels in excess of 40%.
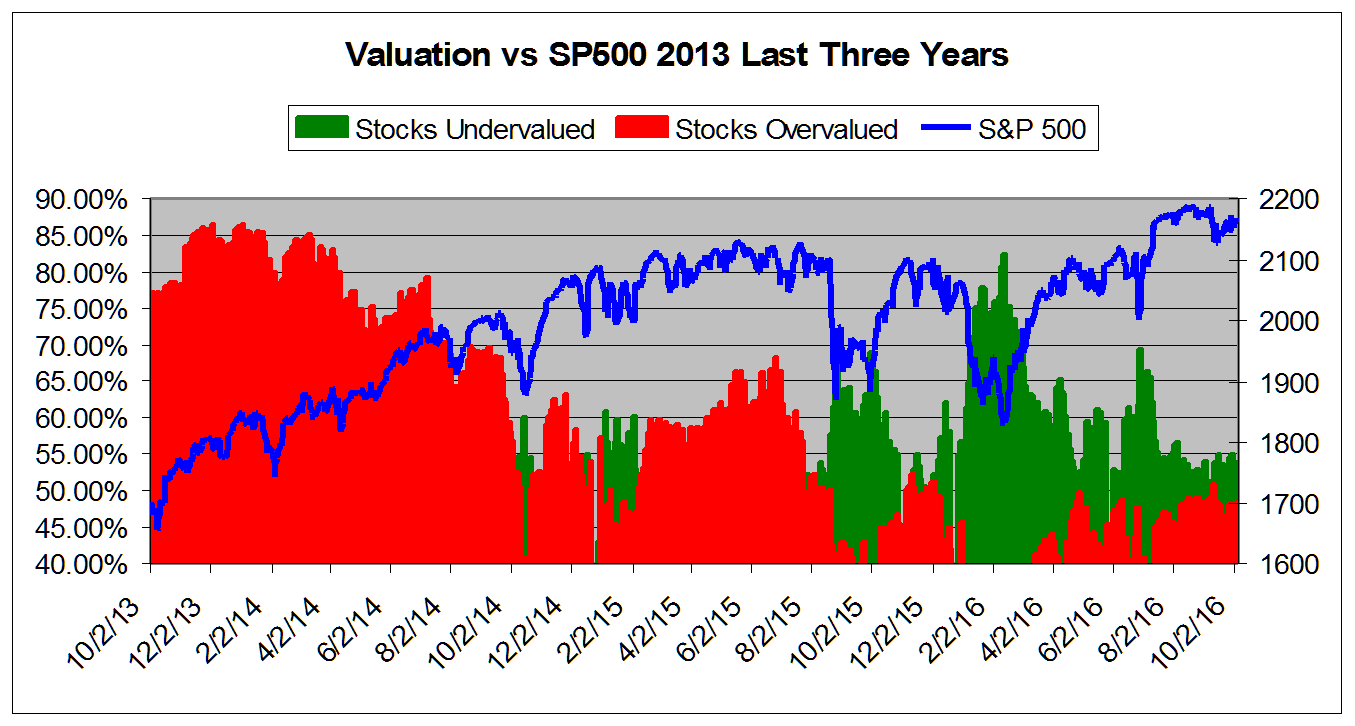
This chart shows overall universe overvaluation in excess of 40% vs the S&P 500 from August 2013
This chart shows overall universe under and over valuation in excess of 40% vs the S&P 500 from March 2007*
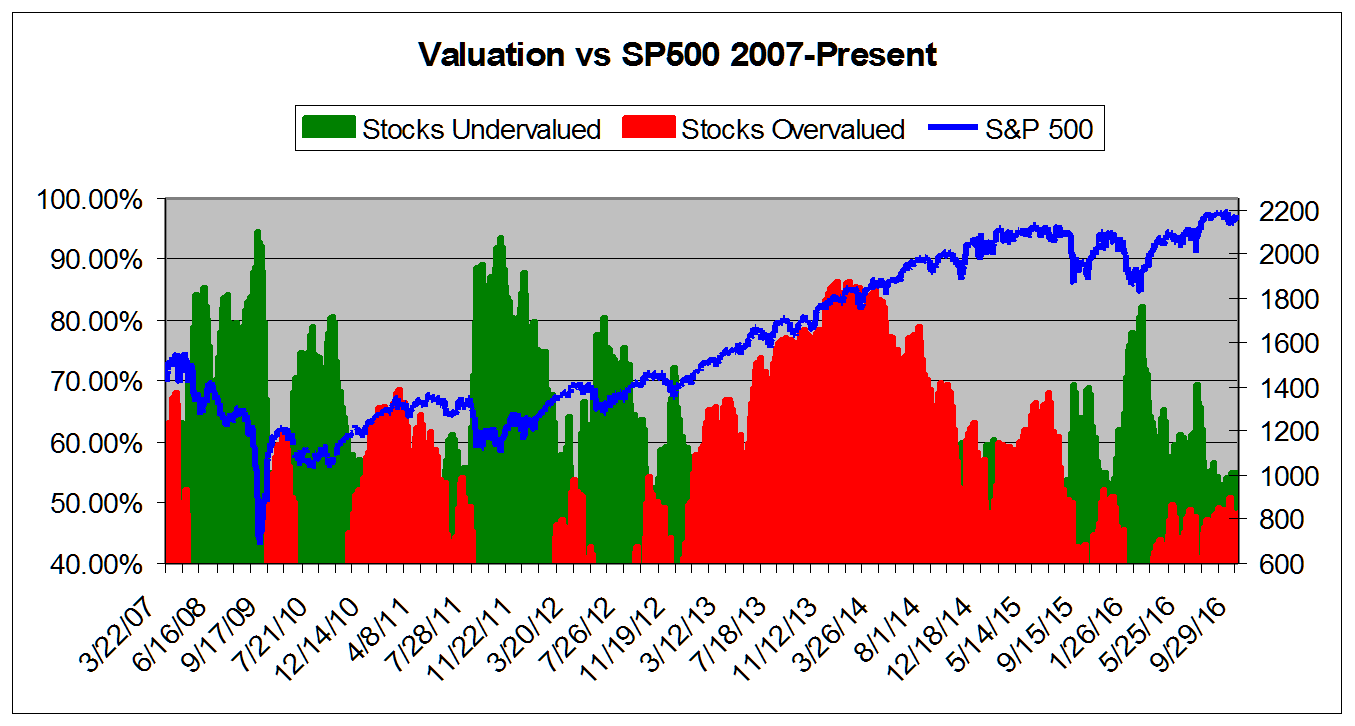
*NOTE: Time Scale Compressed Prior to 2011.
Market Overview
|
Summary of VE Stock Universe |
|
|
Stocks Undervalued |
53.67% |
|
Stocks Overvalued |
46.33% |
|
Stocks Undervalued by 20% |
21.37% |
|
Stocks Overvalued by 20% |
14.43% |
Sector Overview
|
Sector |
Change |
MTD |
YTD |
Valuation |
Last 12-MReturn |
P/E Ratio |
|
Industrial Products |
-0.73% |
-0.97% |
17.65% |
6.07% overvalued |
13.10% |
24.09 |
|
Computer and Technology |
-0.30% |
-0.24% |
18.37% |
5.63% overvalued |
10.55% |
29.36 |
|
Multi-Sector Conglomerates |
-0.33% |
-0.57% |
7.34% |
1.44% overvalued |
1.99% |
20.72 |
|
Consumer Staples |
-0.59% |
-0.74% |
10.30% |
0.96% overvalued |
11.77% |
23.90 |
|
Aerospace |
-0.29% |
-0.27% |
2.60% |
0.78% overvalued |
6.73% |
18.17 |
|
Utilities |
-0.87% |
-1.09% |
10.12% |
0.53% overvalued |
11.21% |
21.78 |
|
Oils-Energy |
-0.59% |
-0.21% |
19.40% |
0.55% undervalued |
-4.32% |
24.94 |
|
Finance |
-0.37% |
-0.71% |
6.81% |
1.21% undervalued |
4.62% |
16.55 |
|
Basic Materials |
-2.56% |
-2.90% |
40.33% |
1.81% undervalued |
51.04% |
28.93 |
|
Business Services |
-0.49% |
0.04% |
14.50% |
1.82% undervalued |
1.09% |
24.72 |
|
Consumer Discretionary |
-0.32% |
-0.09% |
9.55% |
3.31% undervalued |
3.68% |
23.13 |
|
Transportation |
-0.40% |
-0.14% |
11.04% |
4.40% undervalued |
-12.12% |
16.01 |
|
Auto-Tires-Trucks |
-0.30% |
0.10% |
7.56% |
4.49% undervalued |
7.34% |
13.87 |
|
Medical |
-0.27% |
-0.08% |
2.31% |
4.70% undervalued |
-7.06% |
26.52 |
|
Construction |
-0.39% |
-0.48% |
30.74% |
5.85% undervalued |
13.59% |
19.89 |
|
Retail-Wholesale |
-0.24% |
-0.21% |
0.29% |
6.29% undervalued |
-3.14% |
21.96 |
Valuation Watch: Overvalued stocks now make up 46.33% of our stocks assigned a valuation and 14.43% of those equities are calculated to be overvalued by 20% or more. Six sectors are calculated to be overvalued.
Disclaimer: ValuEngine.com is an independent research ...
more

