Nomura Has Just One Word As Treasurys Tumble
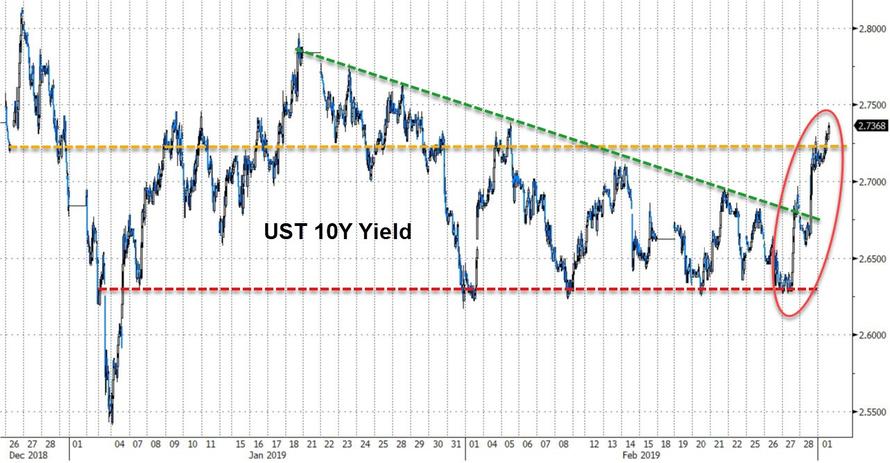
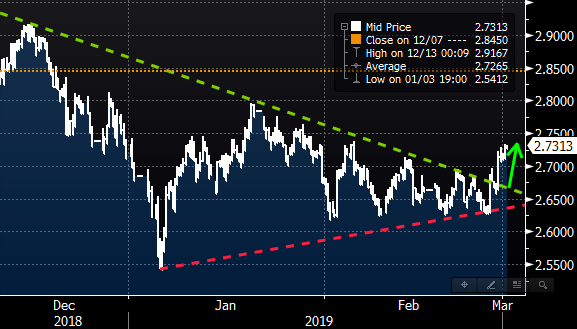
After going almost nowhere for 2 months, bond yields are sharply higher again after decisively breaking out of the descending triangle two days ago, having jumped 12bps in just the past 2 days (for a variety of reasons discussed most recently last night)...
... and this is great news to Nomura's Charlie McElligott who has been predicting the sharp curve steepening we are observing for the past 2 months, most recently two days ago when he doubled down his call for a resurgence in the "reflation trade".
Commenting on the latest sharp move higher in yields which is taking place alongside the "risk-on" rally in stocks together with the ongoing bonds bear-steepening, McElligott attributes it to two key drivers:
- Bloomberg reported at 1:37am EST overnight that U.S. officials are preparing a final trade deal that President Trump and Chinese counterpart Xi Jinping could sign in weeks (with a summit as soon as mid-March);
- At 6:30am EST, MNI came out with an exclusive story from government advisor “sources” stating that “China is set to announce further fiscal stimulus to boost a slowing economy, with measures likely to include raising the budget deficit, increasing quotas for local government debt and further cutting taxes and fees”
Having emerged as a key driver of the "reflation" narrative largely thanks to its record credit injection in January, China next week could see the announcement of reduced tax burdens, with policymakers and politicians gathering for the annual “Two Sessions” meetings, with “lower employer social insurance payments, value-added tax rate cuts and even corporate income tax (cuts)” all as possibilities according to Nomura. Additionally, Charlie adds that according to reports, the targeted budget deficit ratio will increase this year from 2.6% of gross GDP seen in 2018—and that even though “above 3% remains taboo,” Jia Kang—the former head of a Finance Ministry research institute, told MNI that authorities should consider a budget deficit of 3% if not higher, noting the level was only a psychological threshold.
As McElligott explains, "with Bonds now “breaking-down” after having been pricing-in a significant global slowdown, higher Nominals, and the ongoing / grinding CURVE-STEEPENING look like the TACTICAL path of least resistance once again, as the above actions are optically PRO-GROWTH and REFLATIONARY—thus the recent + “Cyclicals over Defensives” within Equities / + Commodities / + Breakevens dynamic should continue in the coming weeks."
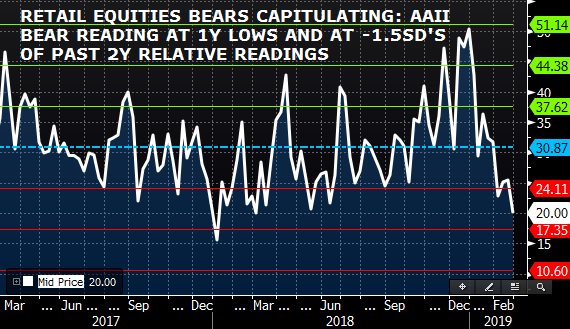
However, as he observed recently, the risk continues to be this sequencing of seemingly idiosyncratic events which could converge in a "March Surprise" risk off event, to create a supply/demand reversal within US Equities just as investors are “forced to chase” back-into the market at the local 4m highs and Retail seeing capitulation from bears, which can be seen in the latest AAII Bears chart, which has hit the lowest level since March 1st, 2018:
While McElligott once again repeats his new argument why the market may hit turbulence heading into the March 15 quarterly op-ex, the focus is on what to expect from bonds, where he sees the "max long" bond deleveraging adjustment only just beginning, for the following reasons:
- In Wednesday’s note “CONSENSUS “LONG” IN BONDS A NEAR-TERM ASYMMETRICAL RISK…” I spoke to “just how bullish” sentiment and positioning was within the Global DM Bond space across both Active- and Systematic- funds—and that this consensual positioning was then at risk “…IF we were to then see any global upside data surprise…”
- What were the metrics I used to capture the “bullish bonds” consensus as of Wednesday morning? Let’s revisit:
- JPMorgan’s US Treasury Investor Sentiment Index this week made new highs since Sep16, a +2 Standard Deviation “bullishness” relative to the past 5 years
- The Nomura QIS Risk Parity model $ notional allocation to USTs sits at highs last seen in May 13, while the overall Global Bond $notional is at our series highs dating back to at least 2011
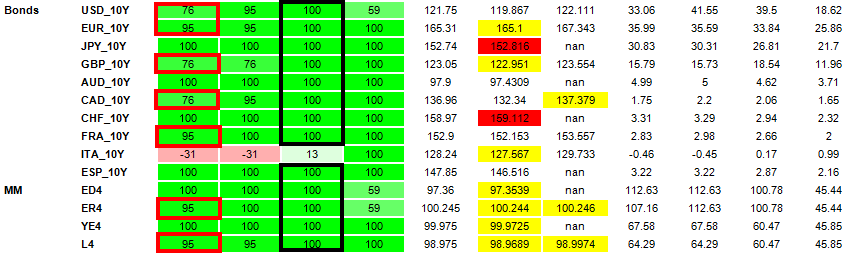
- The Nomura QIS CTA model as of this morning shows an almost consensual “Max Long” across global DM Bonds: “+100% Long” in USD 10Y, JPY 10Y, CAD 10Y, CHF 10Y, FRA 10Y and ESP 10Y, while EUR 10Y, GBP 10Y and AUD 10Y are all “+95% Long”
What does the reversal in inflation sentiment mean for bigger picture themes?
Since McElligott laid out why the market may be wrongfooted with its "bullish bond consensus", we have since seen
- US Pending Home Sales big beat,
- a massive Chicago PMI beat,
- a surprisingly strong US Q4 GDP QoQ and
- Core PCE QoQ…while last night we saw on the global front, we saw
- China Caixin PMI Manufacturing surprise beat to the upside vs survey and prior result as well (48.5 survey, 49.9 actual, 48.3 prior)
Putting all this together, McElligott's one-word assessment was summarized in just one word...
- "BOOM"
... which can be seen as a victory lap of sorts as we have now seen the "global upside data surprise" catalyst - i.e., the reflation trade narrative - which has "sparked the flame" of what is now a pretty visceral stop-out/profit-take/signal-flip/range-break in Rates, with particularly massive volumes at the 3pm ‘marks’ yesterday (MUCH higher than a typical “month end” trade) incuding +33.5k TUM, +82k FVM, +110k TYM, +30.5k USM, +23k WNM, and as we observed on Wednesday, the descending triangle pattern is no more.
So what happens next? Well, as long as the "reflation narrative" is alive, and it appears that economic data may now be turning in both the US (strong GDP, just ignore the dismal spending data) and China (a rebound in the Caixin Mfg PMI), which will force more TSY longs to cover, but the real catalyst will be when the trend-following CTAs capitulate and start shorting 10Y. What is the trigger level to watch? According to Nomura, with 10Y TSY CTAs currently 76% long, they would be buying more above 122.05 to get to 86% , max long over 122.23, while selling would resume under 120.2 to get to 57% , more selling under 119.7 to get to -16% , flip to short under 119.7, max short under 119.36.
The full CTA trigger estimates by asset class are shown below.