
No Slowdown In Services Sector
If this is a slowdown, we’ll take it. While economic data clearly slowed in December and January due to a combination of equity market weakness, the government shutdown, and other factors, activity really appears to have bounced back in February. In the case of the ISM Non-Manufacturing report, February not only increased versus January’s reading of 56.7, but it also came in higher than the consensus expectation of 57.4. At 59.7, February’s report was just slightly more than one point below the cycle high of 60.8 from back in September. On a combined basis and accounting for each sector’s share of the total economy (second chart), the February ISM came in at 59.1 which was nearly two points below the cycle high of 60.7 from back in September. Following the strength of this report, the market is now once again pricing in a higher chance that the FOMC hikes rates between now and next January (8.9%) versus cutting rates (5.6%). Meanwhile, the odds that the FOMC sits on its hand between now and then are at just under 86%. Normally, we would say the odds of the FOMC doing nothing are extremely low, but now that they have the balance sheet to tinker with, a long pause on the Fed Funds rate is certainly a possibility.
(Click on image to enlarge)

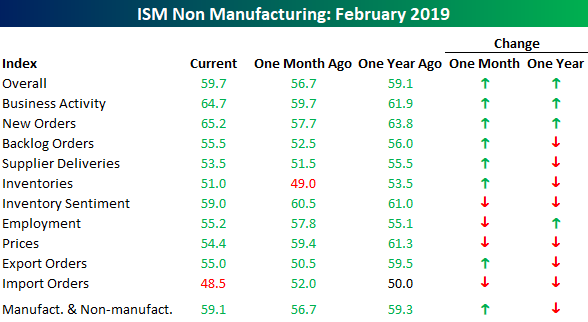
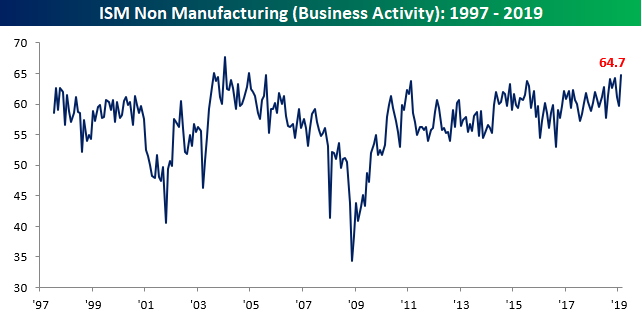
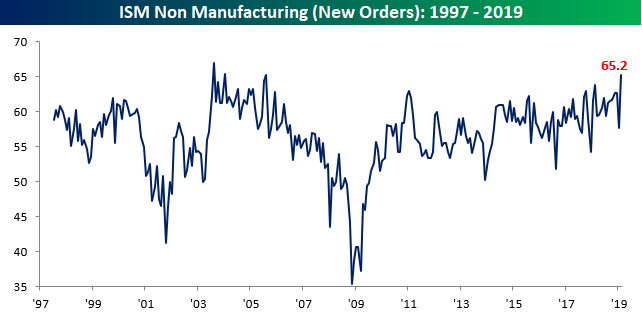
The table below breaks down February’s report by each of its sub-components.On a m/m basis, this month’s report saw solid breadth, although versus where things stood a year ago the pace of growth has been less robust.The real stars of this month’s report, however, were Business Activity and New Orders (two charts below table).Business Activity rose to 64.7, which is the highest reading that component has seen since August 2005!New Orders saw an even more impressive move. While it also reached its highest level since August 2005, the m/m increase of 7.5 points was the third largest on record behind only the 9.6 point jump in April 2009 and the 8 point rise in February 2002. Pretty impressive!
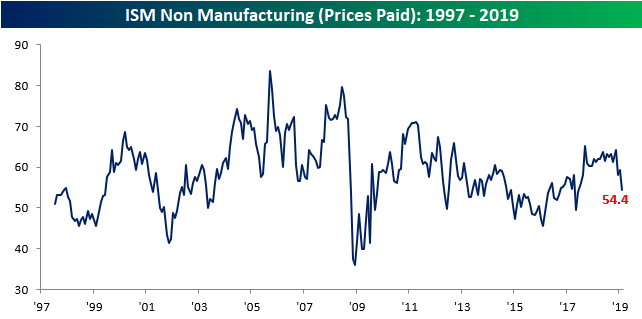
On the downside, Prices Paid saw the largest m/m decline of any component, falling from 59.4 down to 54.4 to its lowest level since June 2017. Behind Prices Paid (lowest chart), the only other components to decline on a m/m basis were Import Orders, Employment (which doesn’t necessarily bode well for Friday’s Payrolls report), and Inventory Sentiment.
(Click on image to enlarge)
(Click on image to enlarge)
(Click on image to enlarge)
(Click on image to enlarge)
Disclaimer: To begin receiving both our technical and fundamental analysis of the natural gas market on a daily basis, and view our various models breaking down weather by natural gas demand ...
more

