
NFIB Small Business Survey: "Small Business Optimism Remains Historically High In November"
The latest issue of the NFIB Small Business Economic Trends came out this morning. The headline number for November came in at 104.8, down 2.6 from the previous month. The index is at the 94th percentile in this series. Today's number came in below the Investing.com forecast of 107.3.
Here is an excerpt from the opening summary of the news release.
Small business optimism posted a modest decline in November with a reading of 104.8, while continuing its exceptionally strong two-year trend, according to the NFIB Small Business Optimism Index. Slightly more than half of the decline was attributable to Expected Business Conditions and Expected Real Sales. Increases in compensation tied a near 30-year high as owners seek to attract more qualified candidates. An increasing percentage of owners reported capital outlays and higher sales.
“Small business owners are enthusiastic about the economy and have demonstrated their optimism by raising wages, creating new jobs, and investing in their businesses throughout 2018,” said NFIB President and CEO Juanita D. Duggan. “Overall, small business owners have shown a historic trend in optimism for their businesses and the economy and continue to be the driving force behind economic growth.”
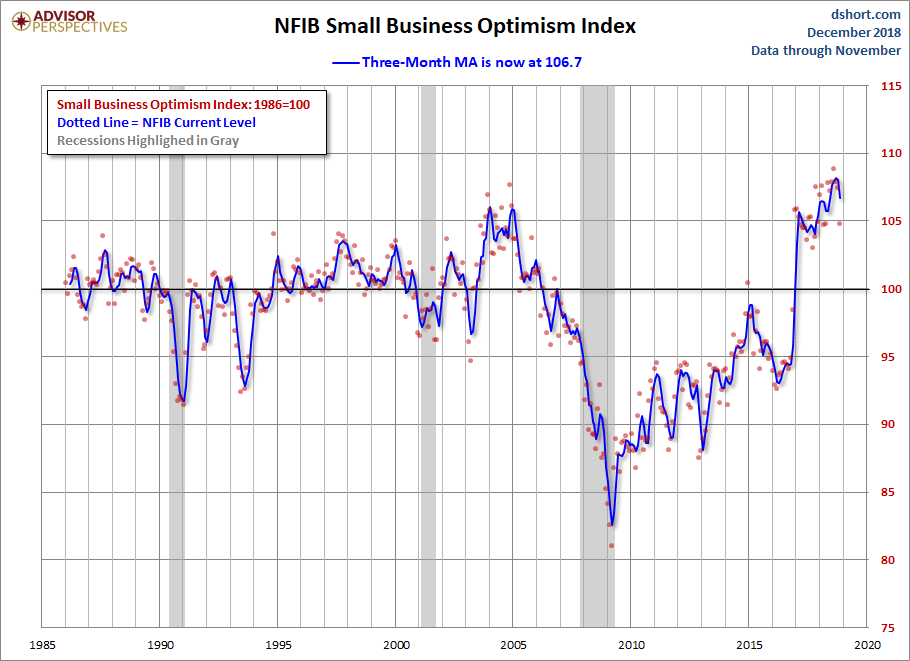
The first chart below highlights the 1986 baseline level of 100 and includes some labels to help us visualize that dramatic change in small-business sentiment that accompanied the Great Financial Crisis. Compare, for example, the relative resilience of the index during the 2000-2003 collapse of the Tech Bubble with the far weaker readings following the Great Recession that ended in June 2009.

Here is a closer look at the indicator since the turn of the century.

The average monthly change in this indicator is 1.3 points. To smooth out the noise of volatility, here is a 3-month moving average of the Optimism Index along with the monthly values, shown as dots.
Here are some excerpts from the report.
Labor Markets
Job creation was solid in November at a net addition of 0.19 workers per firm (including those making no change in employment), up slightly from September and October readings at 0.15.
Inflation
How effective has the Fed's monetary policy been in lifting inflation to it two percent target rate?
The net percent of owners raising average selling prices was unchanged at a net 16 percent, seasonally adjusted. Seasonally adjusted, a net 29 percent plan price hikes (up 1 point), the highest since August 2008. A net 38 percent planned price hikes in July 2008 but quickly fell to a net 0 percent 6 months later as the economy plunged into the Great Recession.
Credit Markets
Has the Fed's zero interest rate policy and quantitative easing had a positive impact on Small Businesses?
hree percent of owners reported that all their borrowing needs were not satisfied, unchanged. Thirty-two percent reported all credit needs met (up 2 points) and 47 percent said they were not interested in a loan, down 5 points, an indicator that loan demand may pick up.
NFIB Commentary
This month's "Commentary" section includes the following observations and opinions:
The general consensus among forecasters is that the fourth quarter will be solid but slower. Growth appears to have peaked early this year and will slow as we move into 2019. There are a number of reasons, primarily structural, for a slowdown including a lack of qualified workers to fill open positions and a low rate of labor force growth. The Congressional Budget Office calculates our potential GDP and its prospective growth path annually. In simple terms, potential growth (with no inflation) is determined by labor force growth and productivity growth. The dramatic decline in investment and labor force growth in 2008 and in the following years significantly altered the potential growth of the economy and its potential growth path. Each year that actual GDP was below its future potential GDP growth shrunk, as capital spending did not add enough to capacity and the labor force participation rate fell. Thus, although our GDP growth finally caught up with potential growth in early 2018, it was at a much lower level of potential growth (see chart, thanks Prof., Lew Spellman, Univ. of Texas).
Business Optimism and Consumer Confidence
The next chart is an overlay of the Business Optimism Index and the Conference Board Consumer Confidence Index. The consumer measure is the more volatile of the two, so it is plotted on a separate axis to give a better comparison of the two series from the common baseline of 100.
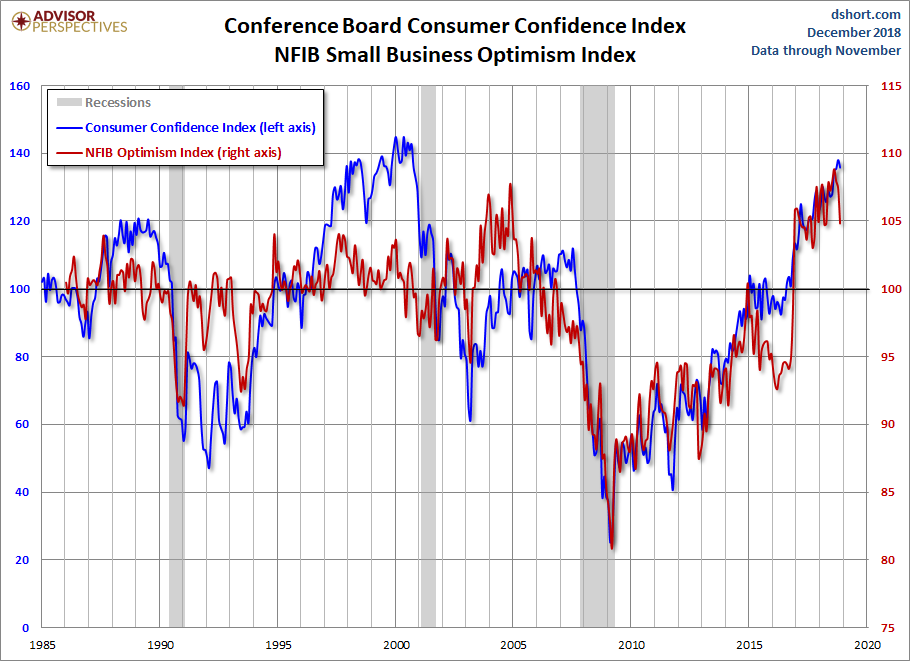
These two measures of mood have been highly correlated since the early days of the Great Recession. The two diverged after their previous interim peaks, but have recently resumed their correlation. A decline in Small Business Sentiment was a long leading indicator for the last two recessions.


