
Newest CoT: Peeking Into The Future Thru Futures
Following futures positions of non-commercials are as of September 10, 2019.
10-year note: Currently net short 300.4k, down 77.4k.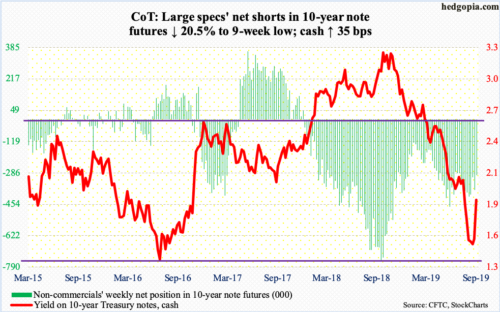
The FOMC meets next Wednesday. In the futures market, the odds of a 25-basis-point easing currently stand at 80 percent. This comes after a reduction of similar magnitude in July, which was the first cut since December 2008. The fed funds rate stands at a range of 200 to 225 basis points.
After this, two more scheduled meetings remain this year – in October and December. By the end of the year, traders are betting that there could be one more cut, although their conviction level is a lot lower than they have for a cut next week.
The Fed is in a bind, as data continue to come in mixed. More often than not, this tends to happen at inflection points. In the 12 months to August, core CPI rose 2.4 percent, which was the highest since September 2008. That said, core PCE – the Fed’s favorite – remains relatively well behaved (chart here). On the other hand, job creation is softening, with a monthly average this year of 158,000 non-farm jobs versus last year’s monthly average of 223,000.
In this sense, the question is not if more cuts lie ahead; rather, if more monetary stimulus at this stage in the cycle will be able to stop the economy from decelerating further. The long end of the Treasury yield curve does not exude much confidence. The 10-year Treasury yield (1.9 percent) nine sessions ago dropped to an intraday low of 1.43 percent, merely nine basis points from the record low 2.34 percent from July 2016. Rates are rallying currently unwinding the oversold conditions they were in. When it is all said and done, a new low in all probability is just a matter of when not if.
30-year bond: Currently net short 51.7k, down 15.5k.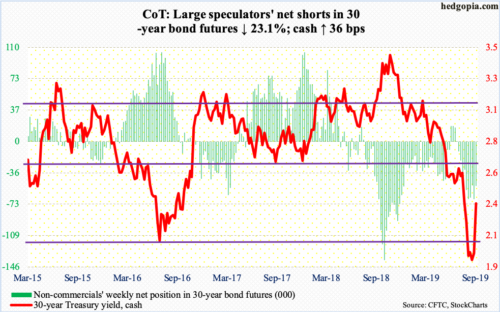
Major economic releases next week are as follows.
Industrial production (August), the NAHB housing market index (September) and Treasury International Capital data (July) are due out Tuesday.
US capacity utilization dropped 1.6 percent year-over-year in July to 77.5 percent. The cycle high 79.6 percent was reached in November 2018.
Home builder activity inched up a point month-over-month in August to 66. The cycle high 74, which was the highest since July 1999, was reached in December 2017.
In the 12 months to June, foreigners sold $135.7 billion in US stocks, which is a big improvement from record net sales of $214.6 billion in April this year.
Wednesday, housing starts (August) are published. In July, starts fell four percent m/m to a seasonally adjusted annual rate of 1.19 million units. The 1.34 million in January 2018 was the highest since July 2007.
Thursday brings existing home sales (August). July sales rose 2.5 percent m/m to 5.42 million units (SAAR). The cycle high 5.72 million – the highest since February 2007 – was recorded in November 2017.
WTI crude oil: Currently net long 583.7k, up 42.7k.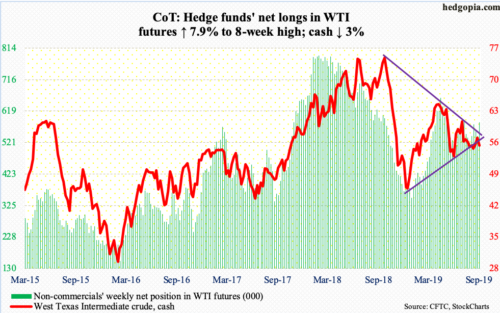
Once again, the cash ($54.85/barrel) was denied at a falling trend line from last October. Tuesday’s intraday high of $58.76 was the highest since mid-July but bulls were not able to hang on to it. Wednesday, both the 50- and 200-day moving averages, which are now converging, were lost. Thursday, trend-line support from last December was lost intraday but was saved by close. In essence, WTI continues to remain trapped between these two trend lines. The risk is to the downside. There is decent support at $50-51.
Wednesday’s drop was also prompted by a Bloomberg News report that President Donald Trump discussed easing sanctions on Iran. The EIA report for the week of September 6 – out that day – otherwise was not that bad. Crude production was unchanged at 12.4 million barrels per day. Crude imports dropped 179,000 bpd to 6.7 mbpd. Stocks of crude and gasoline declined 6.9 million barrels and 682,000 barrels respectively to 416.1 million barrels and 228.9 million barrels. Distillate stocks, however, rose 2.7 million barrels to 136.2 million barrels. Refinery utilization inched up three-tenths of a percentage point to 95.1 percent.
E-mini S&P 500: Currently net short 16.4k, up 28.7k.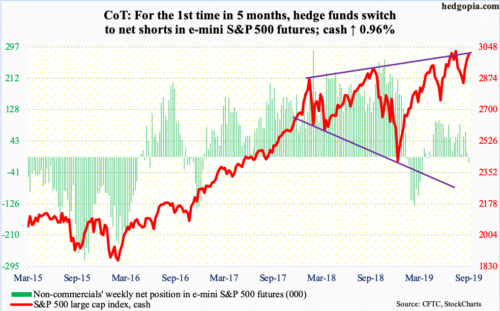
Last week’s breakout apparently helped buoy sentiment. Investors Intelligence bulls jumped 5.1 percentage points this week to 50 percent. In the week to Wednesday, US-based equity funds gained $6.8 billion (courtesy of Lipper). In the same week, SPY (SPDR S&P 500 ETF), VOO (Vanguard S&P 500 ETF) and IVV (iShares Core S&P 500 ETF) attracted a combined $8.2 billion (courtesy of ETF.com).
At the same time, money-market assets continued to accumulate. In the week through Wednesday, these funds grew $16.8 billion week-over-week to $3.4 trillion, which was the highest since mid-October 2009 (courtesy of ICI). For sustained momentum in stocks, these funds need to contract.
Near term, the daily is way extended. At Thursday’s intraday high, the cash (3007.39) was merely 0.24 percent from its all-time high of 3027.98 from July 26. In the end, the session produced a long-legged doji right at the daily upper Bollinger band. Breakout retest takes place at 2940s.
Euro: Currently net short 49.8k, up 706.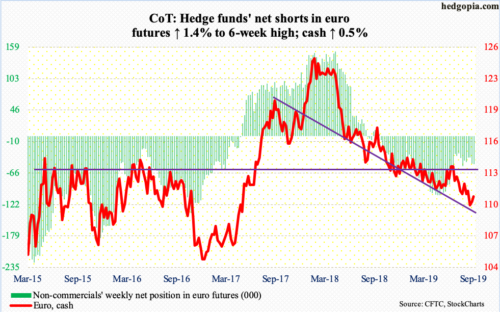
The ECB Thursday cut the deposit rate by 10 basis points to minus 0.5 percent as well as launched a new round of QE. The bank plans to buy €20 billion a month worth of bonds beginning November 1. Early on in that session, the cash ($110.78) dropped as much as 0.8 percent but that weakness was bought near horizontal support north of $109. Thursday’s intraday low of $109.27 undercut last week’s low by two pennies but only to see buyers show up to push it up 0.5 percent by close, for a big reversal candle. Bulls need to recapture broken-support-turned-resistance at $111 if they are to build on this.
Gold: Currently net long 269.7k, down 30.8k.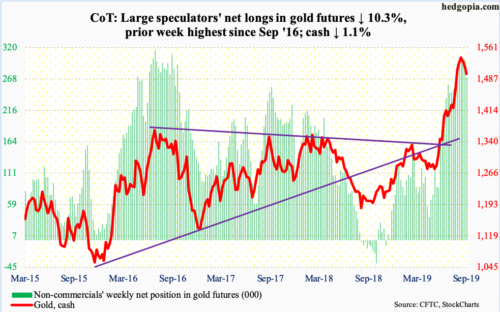
For the third week running, the cash ($1,499.50/ounce) came under pressure this week, down 1.1 percent. Last Wednesday, gold tagged $1,566.20 intraday. It has struggled in the $1,540s-50s for five weeks now. In September 2011, the yellow metal peaked at record $1,923.70 and began to unravel after it lost $1,540s-50s. This level is important. As well, a 61.8-percent Fibonacci retracement of the September 2011-December 2015 decline lies at $1,588.
The daily is getting oversold, but overbought weekly indicators have a long way to go on the downside.
Amidst this, $651 million came out of GLD (SPDR Gold ETF) in the week to Wednesday. This was the first down week in four and second in 17. IAU (iShares Gold Trust) gained $226 million – 12th positive week in 13 (courtesy of ETF.com).
Nasdaq 100 index (mini): Currently net long 26.9k, up 2.4k.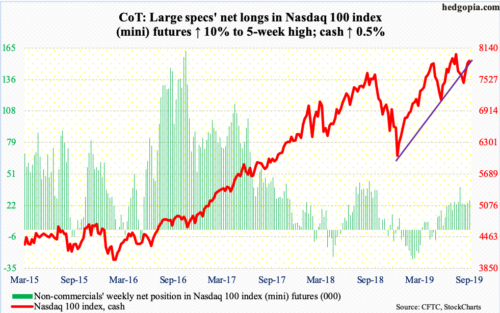
In the week through Wednesday, QQQ (Invesco QQQ Trust) gained $1.3 billion (courtesy of ETF.com). In the prior two, $186 million came in.
Thursday, the cash (7892.95) came within 0.65 percent of its all-time high of 8027.18 posted on July 26. Bulls were unable to hang on to the early gains in that session, in the end forming a shooting star just outside the daily upper Bollinger band.
The daily is grossly overbought. Just last week, the Nasdaq 100 broke out of one-year horizontal resistance at 7700, with the 50-day at 7767. Breakout retest is the path of least resistance near term.
Russell 2000 mini-index: Currently net short 50.2k, down 8.7k.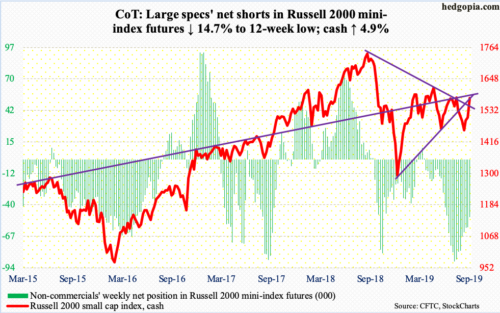
Small-cap stocks got their mojo back this week. Out of nowhere, the cash shot up 4.9 percent. In contrast, the S&P 500 was up one percent and the Nasdaq 100 0.5 percent. In the week ended Wednesday, IWM (iShares Russell 2000 ETF) took in $2.9 billion, while IJR (iShares Core S&P Small-Cap ETF) lost $83 million (courtesy of ETF.com).
In the process, the Russell 2000 (1578.14) not only reclaimed the 50- and 200-day but also a declining trend line from August last year when the index peaked at 1742.09. There was one more roadblock bulls needed to get over, which was the underside of a broken rising trend line from last December around 1590. Friday, in a gravestone doji session, the index retreated from an intraday high of 1589.45. Bulls have their work cut out.
US Dollar Index: Currently net long 32k, up 296.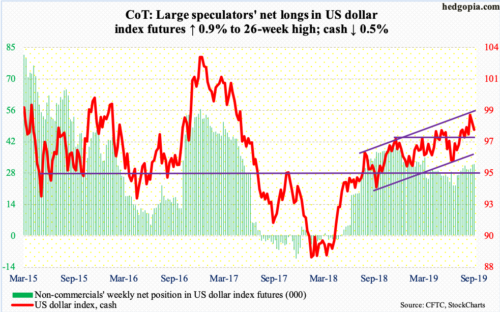
Last week’s intraday high of 99.33 kissed the upper end of a one-year rising channel. This week, the cash (97.83) fell 0.5 percent. Thursday in particular, when the aforementioned ECB decision came out, the US dollar index had a wild session with a high of 98.67 and a low of 97.62; the session low tagged the 50-day (97.67), which was again defended on Friday. Plus, there is decent support at 97.50s, a breach of which opens the door to a test of channel support at 96.
VIX: Currently net short 93.4k, up 26.8k.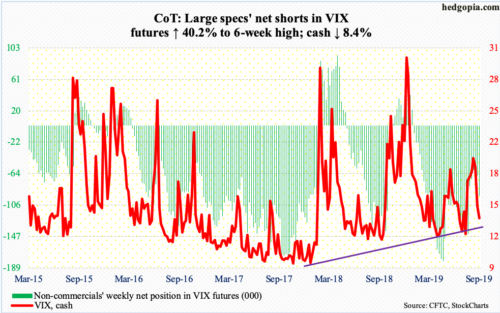
Both Monday and Tuesday, the cash (13.74) went after the 50-day (16.24) but was rejected. In the best of circumstances for volatility bears, VIX continues lower toward 12. Even under this scenario, unwinding of now-oversold daily condition is looking probable.
Concurrently, the 21-day moving average of the CBOE equity-only put-to-call ratio ended the week at 0.656. On August 23, it peaked at 0.733. Unwinding is still possible until the ratio reaches high-0.50s to low-0.60s. That said, optimism remains way elevated near term. In five of the last seven sessions, the ratio on the daily basis registered 0.50s.


