
New Zealand Dollar Weekly Price Outlook: Kiwi Coils Into January Range
In this series, we scale-back and look at the broader technical picture to gain a bit more perspective on where we are in trend. The New Zealand Dollar is up nearly 0.4% against the US Dollar this week as price continues to contract within the January opening-range. Here are the key targets & invalidation levels that matter on the NZD/USD weekly chart.
NZD/USD WEEKLY PRICE CHART
(Click on image to enlarge)
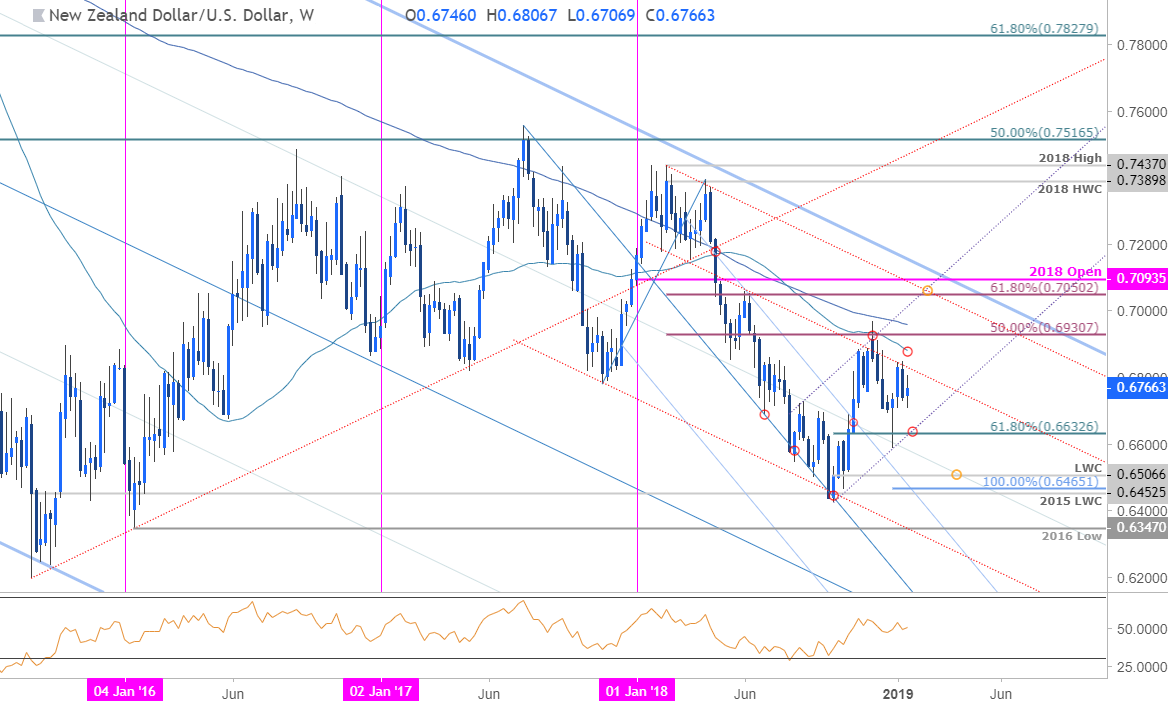
Notes: Kiwi started the year with a quick defense of the 61.8% retracement` of the October advance at 6632 (intraday spike low registered at 6586) before rebounding sharply with price testing monthly open support this week at 6705. The late-2018 advance looks to have taken the shape of a 5-wave advance off the lows and suggests this pullback from the December high may be a correction. That said, the focus would be for a new low before resumption higher towards broader pitchfork resistance (blue).
Initial weekly resistance stands with the parallel (red) backed by the 52-week moving average at ~6880s and the 50% retracement of the 2018 range at 6931- a breach / close above this threshold is needed to fuel the next leg higher targeting the 200-week moving average at ~6960s and the key 61.8% retracement at 7050.
Critical support remains with the October slope line / 6632 with a break / close below exposing subsequent support objectives at the 2018 low-week close at 6507 and the 100% extension / 2015 LWC at 6453/65- both levels of interest for exhaustion / long-entries IF reached.
Bottom line: Kiwi continues to trade within the confines of a broad January opening-range and while I do think the bigger move ultimately is higher, the threat remains for another test of the lows before resumption. Form a trading standpoint, the focus is on a test of the monthly lows – IF price can stabilize above 6632, look for a breach above the range highs to fuel the next leg higher in New Zealand Dollar.
NZD/USD TRADER SENTIMENT
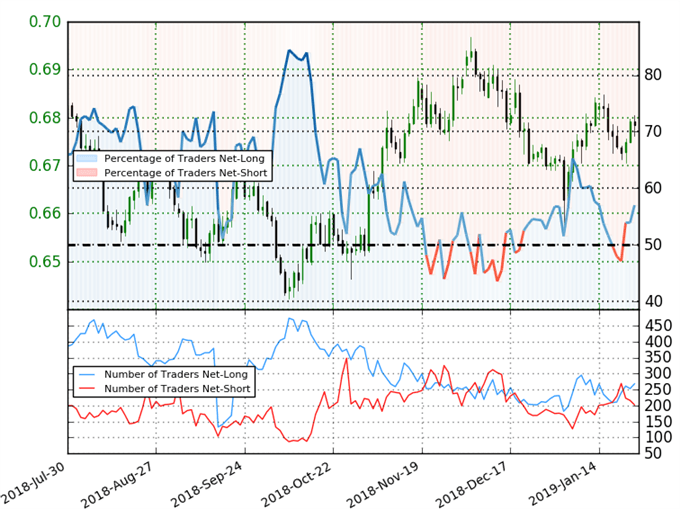
- A summary of IG Client Sentiment shows traders are net-long NZD/USD - the ratio stands at +1.33 (-57.0% of traders are long) – bearish reading
- Long positions are 9.4% higher than yesterday and 22.9% higher from last week
- Short positions are 0.5% higher than yesterday and 6.5% lower from last week
- We typically take a contrarian view to crowd sentiment, and the fact traders are net-long suggests NZD/USD prices may continue to fall. Traders are further net-long than yesterday and last week, and the combination of current positioning and recent changes gives us a stronger NZD/USD-bearish contrarian trading bias from a sentiment standpoint.
Disclosure: Do you want to see how retail traders are currently trading the US Dollar? Check out our IG Client Sentiment ...
more

