
New Zealand Dollar Weekly Price Outlook: Kiwi 2019 Range Compression
In this series, we scale-back and look at the broader technical picture to gain a bit more perspective on where we are in trend. Kiwi has continued to consolidate against the US Dollar with the 2019 opening-range of nearly 3% still intact heading into the close of February trade. These are the updated targets and invalidation levels that matter on the NZD/USD weekly chart. Review this week’s Strategy Webinar for an in-depth breakdown of this setup and more.
NZD/USD WEEKLY PRICE CHART
(Click on image to enlarge)
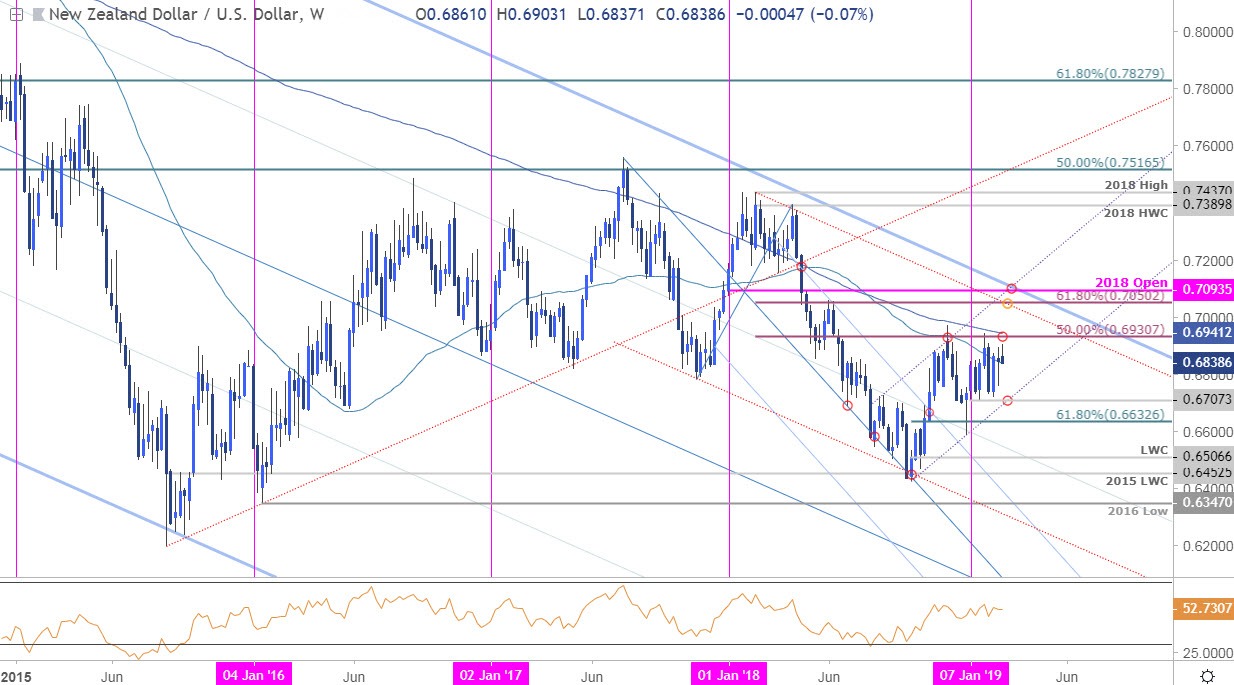
Notes: In last month’s NZD/USD Weekly Technical Outlook we noted that Kiwi continues to trade within the confines of a broad January opening-range and while I do think the bigger move ultimately is higher, the threat remains for another test of the lows before resumption.” Since then, price has carved out an even clearer range between 6707-6941and the focus heading into the close of the month is on a break of this range.
A downside break / close below this range targets the 61.8% retracement of the October range at 6633backed by the 2018 low-week close at 6506. Weekly resistance stands at 6931/41- a region defined by the 50% retracement of the 2018 range and the 200-week moving average. A rally surpassing this threshold is needed to fuel the next leg higher in price targeting critical resistance objectives at the 61.8% retracement at 7050 and the 2018 open / pitchfork resistance at 7094-7100.
Bottom line: The Kiwi range continues and the longer this holds, the bigger the break. From a trading standpoint, price is now coming off the range highs and until we clear 6707-6941 – the medium-term outlook remains natural. That said, ultimately a topside breach and test of the upper parallels is favored.I’ll publish an updated NZD/USD Technical Outlook once we get further clarity on near-term price action.
NZD/USD TRADER SENTIMENT
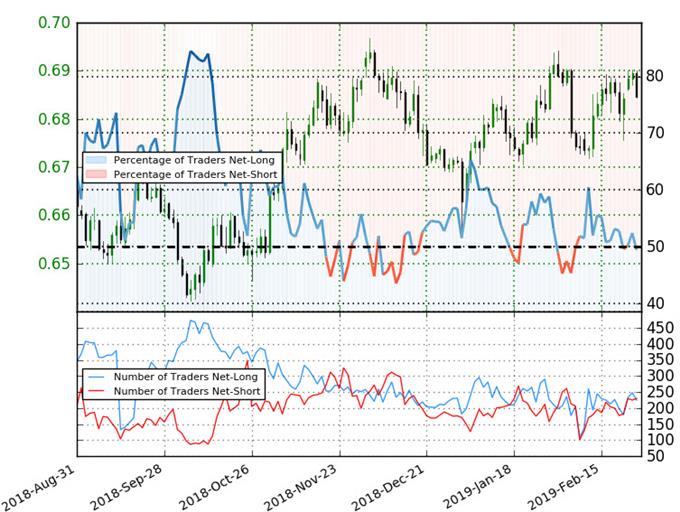
- A summary of IG Client Sentiment shows traders are net-short NZD/USD - the ratio stands at -1.02 (49.5% of traders are long) – neutral reading
- Long positions are6.3% lower than yesterday and 6.3% lower from last week
- Short positions are 2.5% lower than yesterday and 7.5% higher from last week
- We typically take a contrarian view to crowd sentiment, and the fact traders are net-short suggests NZD/USD prices may continue to rise. Traders are further net-short than yesterday and last week, and the combination of current sentiment and recent changes gives us a stronger NZD/USD-bullish contrarian trading bias.


