
New Residential Building Permits: 1.326M In December, Better Than Forecast
The U.S. Census Bureau and the Department of Housing and Urban Development have now published their findings for November new residential building permits. The latest reading of 1.326M was a slight increase from 1.322M in November and above the Investing.com forecast of 1.290M.
Here is the opening of this morning's monthly report:
Building Permits
Data collection and processing were delayed for this indicator release due to the lapse in federal funding from December 22, 2018 through January 25, 2019. Although released for the first time this month, the December 2018 estimates of housing units authorized by building permits include late reports and corrections normally associated with the first revision to the estimates. While response rates were consistent with normal levels, delays in data collection could make it more difficult to determine exact start and completion dates. However, processing and data quality were monitored and no significant issues were identified.
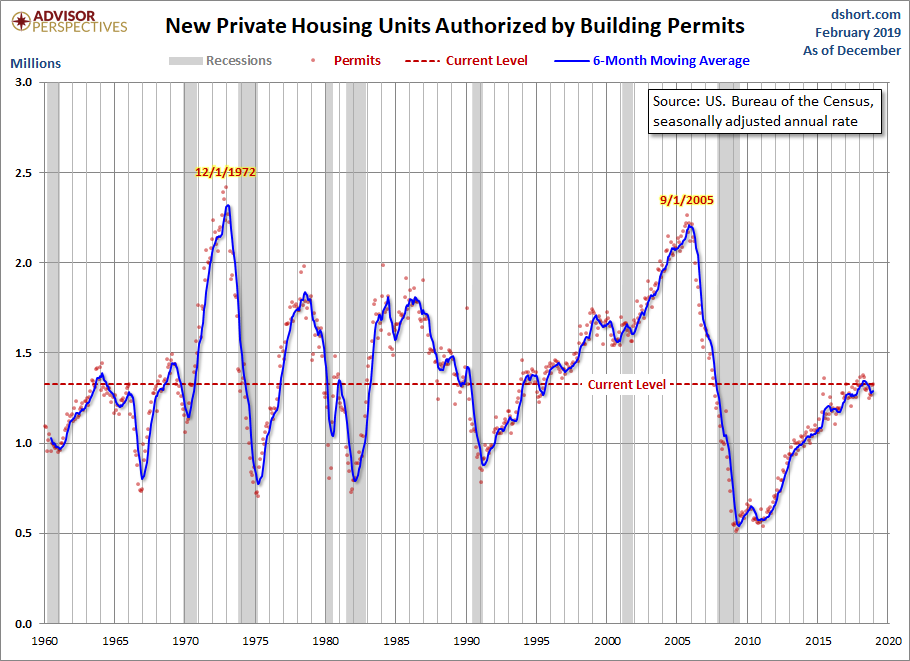
Privately‐owned housing units authorized by building permits in December were at a seasonally adjusted annual rate of 1,326,000. This is 0.3 percent (±1.2 percent)* above the revised November rate of 1,322,000 and is 0.5 percent (±1.1 percent)* above the December 2017 rate of 1,320,000. Single‐family authorizations in December were at a rate of 829,000; this is 2.2 percent (±0.7percent) below the revised November figure of 848,000. Authorizations of units in buildings with five units or more were at a rate of 460,000 in December.
An estimated 1,310,700 housing units were authorized by building permits in 2018. This is 2.2 percent (±0.6%) above the 2017 figure of 1,282,000. [link to report]
Here is the complete historical series, which dates from 1960. Because of the extreme volatility of the monthly data points, a 6-month moving average has been included.
Here is the data with a simple population adjustment. The Census Bureau's mid-month population estimates show substantial growth in the US population since 1960. Here is a chart of housing starts as a percent of the population. We've added a linear regression through the monthly data to highlight the trend.

A Footnote on Volatility
The extreme volatility of this monthly indicator is the rationale for paying more attention to its 6-month moving average than to its noisy monthly change. Over the complete data series, the absolute MoM average percent change is 4.4%. The MoM range minimum is -24.0% and the maximum is 33.9%.
For visual confirmation of the volatility, here is a snapshot of the monthly percent change since 1990.


