
NCoV Fears Reignited, USD Buying Persists
The USD keeps its bullish course of action, aided by another strong US NFP report last Friday. The Yen found fresh buy-side flows after closing the upside gap on its index. The CAD keeps defying the bearish trend as the local jobs data keeps impressing the market. The Oceanic currencies got dumped again. For a detailed coverage, keep reading...
Quick Take
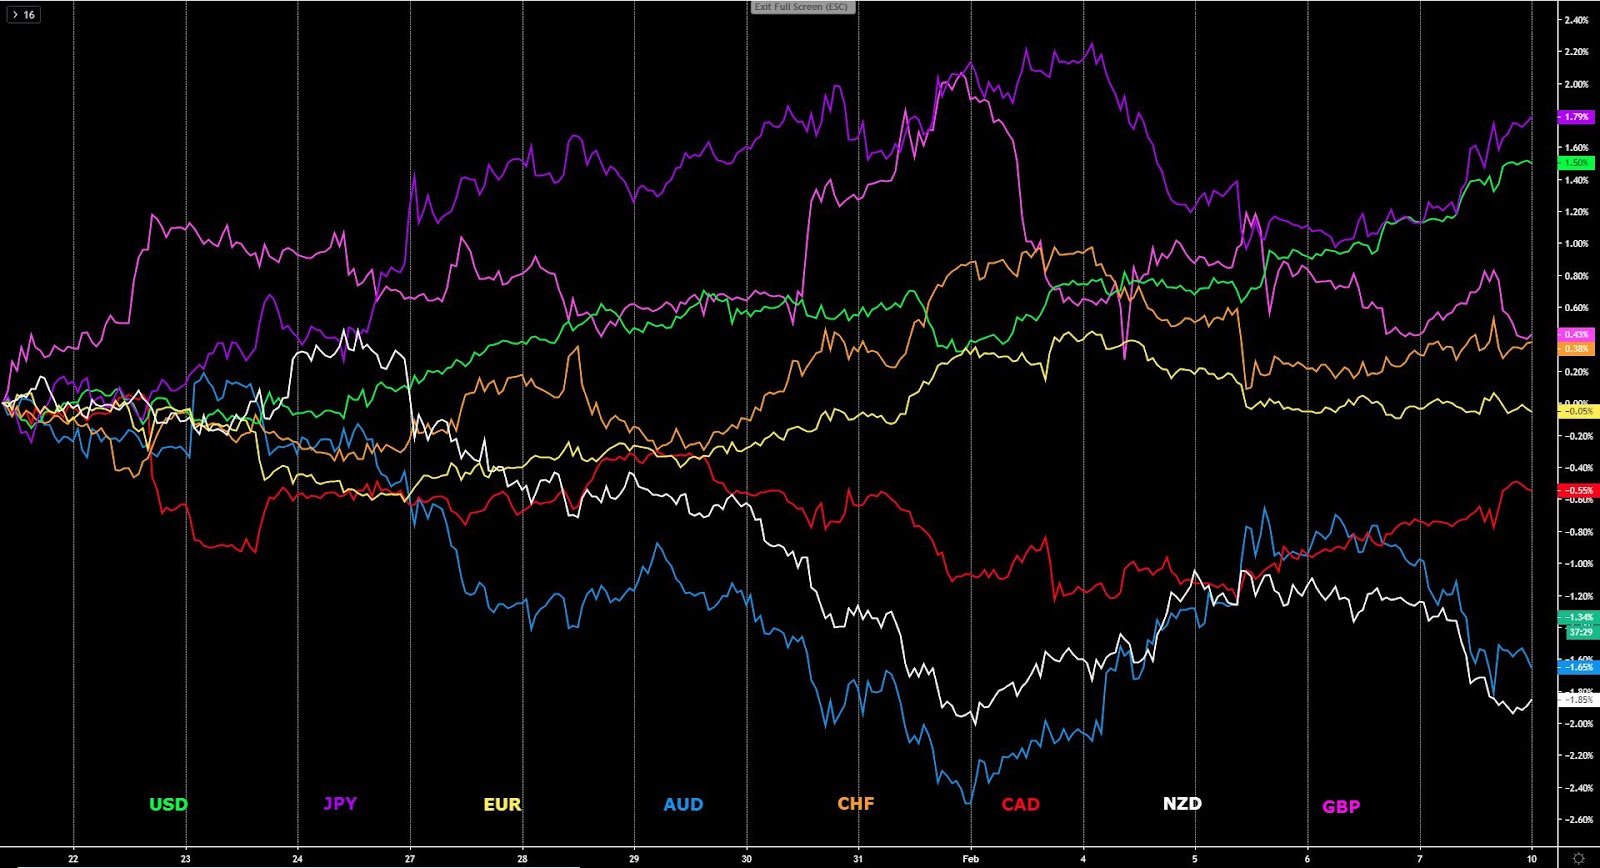
A renewed surge on risk aversion reignited the Yen, while the USD, invigorated by a solid US NFP, and backed up by strong technicals, also rose, in tandem with the appreciation seen in the Canadian Dollar as the domestic employment numbers topped expectations. The Swiss Franc managed to firm up its stance amid this risk-off dynamics, but far from amassing the most demand last Friday; the outlook, nonetheless, remains quite positive when unwrapping the technical readings. The new episode of risk unwinding in the markets came as the number of deaths caused by the NCoV now exceed SARS (813 v 774), even if the predictions by several epidemiologists of prestige see a peak in the NCoV in Wuhan by mid-late February. As a consequence of the sell-off in risk assets, the Aussie and Kiwi, the two favorite shorts acting as a proxy for China and global growth, got dumped right off the gates last Friday. The Euro continues to trade in a confined range at an index level amid the lack of clear catalysts, while the Pound is still attracting committed sellers since the highs printed over a week ago as the UK enters a tricky period of trade negotiations with the EU.
(Click on image to enlarge)
Narratives In Financial Markets
* The Information is gathered after scanning top publications including the FT, WSJ, Reuters, Bloomberg, ForexLive, Institutional Bank Research reports.
US NFP aids the king of Forex (USD): The US January NFP topped estimated with a number of +225K vs +165K expected. As part of this last report, it was also learned that the annual revisions cut 514K jobs from the 2018-2019 payrolls. The unemployment rate edged up to 3.6% vs 3.5% expected, but that was driven by a tick up in participation rate to 63.4% vs 63.2% prior. The average hourly earnings rose to +0.2% m/m vs +0.3% exp, while the yearly reading improved to +3.1% y/y vs +3.0% exp. Overall, the report shows another strong reading as hirings continue. The US Dollar found enough underlying demand to end Friday as the top performer, reflective of the solid jobs data.
The CAD goes for a bullish ride post Canadian jobs: The Canadian net change in employment for January came at 34.5K vs 17.5K estimate, which was a significant jump from what economists had been calling for, resulting on yet another day of follow-through demand in the Canadian Dollar. The full-time employment change was really strong at 35.7 K vs 33.9 K revised, while the part-time employment change was marginally negative at -1.2 K vs -6.5 K revised. The unemployment rate was 5.5% vs 5.7% estimate, while the hourly wage rate for permanent employees stood at YoY 4.4% vs 3.6% estimate. This report should definitely tame down expectations for an immediate BOC rate cut. Additionally, the Canadian January Ivey PMI surged to 57.3 vs 51.9 prior, reinforcing the positive inputs.
Fed fails to offer new insights, warns of the virus risks: The Fed published its semi-annual monetary policy, noting that the downside risks eased in late 2019 as a phase 1 trade deal with China was sealed but the phenomenon of the coronavirus is now a new threat to monitor closely. The Fed saw the US economy growing moderately last year as the labor market strengthened further and inflation continued to run below target. The Central Bank detailed that the probability of a recession in the next year had 'fallen noticeably' in recent months. In terms of the consumer spending and services activities, the Fed remains optimistic as its continues to hold up well. In terms of asset valuations and business debt, remain elevated but the leverage in the financial sector is low by historical norms, the Fed notes.
Where are we at in the NCoV situation? The latest updates on the coronavirus show an additional 89 deaths in mainland China on Saturday, bringing the total death toll around the world to at least 813 (these official figures are thought to be only a fraction of the suspected real ones). The number of confirmed cases has risen to nearly 30,000 in Hubei alone (again, it largely downplays the real ones). According to several sources, the global number of infected nears 40,000, most in mainland China. It’s also made headlines that the the number of people killed by the novel coronavirus globally has now overtaken the total death toll for the SARS outbreak in 2003, which killed 774 people across the world. The World Health Organization announced it will send a team to China to investigate the outbreak of the deadly virus, with the team leader leaving for the country today.
The PBOC to keep stimulating the economic activity: The PBOC (China’s Central Bank) is set to inject more stimulus measures in order to guarantee stability in financial markets following the flooding of liquidity into the system last week. The PBOC is set to issue the first lot of special re-lending funds for combating the coronavirus. The facility will be offered weekly to banks later in Feb. ThePBOC also said financial institutions should quicken the review process for loan applications & release loans within 2 days. These loans from special re-lending funds will be offered at up to 100bp below the one-year Loan Prime Rate (3.15%). All these measures should act as stimulants for the economy.
Outlook for Australia, New Zealand dampened on NCoV woes: We are starting to get the first bank research estimates of the impact from the coronavirus in the economies most exposed due to trade ties. In the case of New Zealand, the GDP forecast has been lowered to 0.8% for H1 from 1.3% by the Economics team at ANZ. As the bank notes, “uncertainty is extreme and we hope the virus is contained soon and the impact temporary.” Meanwhile, in Australia, the hit to Australia’s economy from the viral epidemic spreading from China is likely to be “significant”, Prime Minister Scott Morrison said on Thursday.
Global economic activity to take a hit: As per the impact in the global economy, Goldman Sachs sent a report late last week that the overall impact on global growth could be about a 2% cut in Q1, expecting growth to normalize in the following quarter. Goldman's baseline assumption is that the "aggressive response from the authorities in China and elsewhere will bring the rate of new infections down sharply by the end of Q1." As Goldman reports, “it will be another two weeks or so before we start to receive traditional macro data that could show a direct impact from the coronavirus outbreak and associated containment measures. Until then, market participants will need to continue to rely on sector-specific information such as news reports on factory closures and high frequency trackers of things like passenger travel and utility consumption.”
MAS warns to be prepared: The Singaporean central bank (MAS) advised financial institutions to take additional precautions in light of the coronavirus outbreak. A statement from the Monetary Authority of Singapore over the weekend notes that firms should "continue to maintain effective internal controls across their operations should split team arrangements be implemented." Besides, it was detailed that firms should anticipate and be prepared to manage any increase in demand for certain financial services, such as cash withdrawal or online financial services. The SGD has recently been on a downward spiral as the MAS hinted at monetary easing measures via a widening of the SGD trading band, leading to over 2 weeks of constant SGD selling.
Japanese ‘whale’ in action? According to a report by the Nikkei, Japan's pension 'whale' is suspected of harpooning the yen, in other words, there is growing talk that the coronavirus may have prompted Japan to stabilize the value of its currency using its mammoth-size retirement fund (GPIF), which is dubbed ‘the whale’. The GPIF is the world's biggest pension fund at 160 trillion yen ($1.45 trillion). As the report details, “currency market speculation is circulating that Japanese authorities began selling the yen, using cash from the Government Pension Investment Fund, and that China's central bank is conducting huge open market operations. One market player credited this week's yen-dollar exchange rate moves to a "joint fund supply by Japan and China."
Accumulation of Gold through ETFs continues: Gold has been lagging behind in terms of performance since the NCoV outbreak, however, it has nonetheless amassed marginal gains. However, what’s caught my attention is a report by Saxo Bank that details that “despite the lack of prime movements, investors have continued to accumulate gold through exchange-traded funds backed by bullion. Total holdings have, in the last 3 weeks, risen by 65 tons to 2,585 tons, breaking the previous record from 2012. Since the NCoV scare made it to mainstream on Jan 22, WTI crude oil is the worst performing asset with declines of more than 15%.
Recent Economic Indicators & Events Ahead
(Click on image to enlarge)

(Click on image to enlarge)

Source: Forexfactory
Insights Into FX Index Charts
The risk dynamics, as assessed via the risk-weighted index, have deteriorated once again, with the sharp fall in US bond yields primarily, and to a lesser extent equities, weighing. The pick up in risk aversion was also reflected in the rise seen through the USD/CNH exchange rate, which fueled further downside in the Aussie as I will unwrap below. The VIX (fear index), and direct inversion to the S&P 500, is still far from the elevated levels from last week.
(Click on image to enlarge)

The EUR index keeps finding buying interest at a location where I would be expecting bullish behaviour to emerge as that’s an area where shorts are being mitigated. Since the price action has been quite limited, I have no option but to reiterate the view I’ve endorsed for a number of days now, that is, my constructive trade premise is predicated on the recent interactions at areas of liquidity. Since the index has landed at the origin of the supply bar that led to the last breakout lower, this is an area where a mitigation of shorts caught wrong-sided may occur, which tends to result in a reversal back up. The smart money tracker remains bullish too.
(Click on image to enlarge)

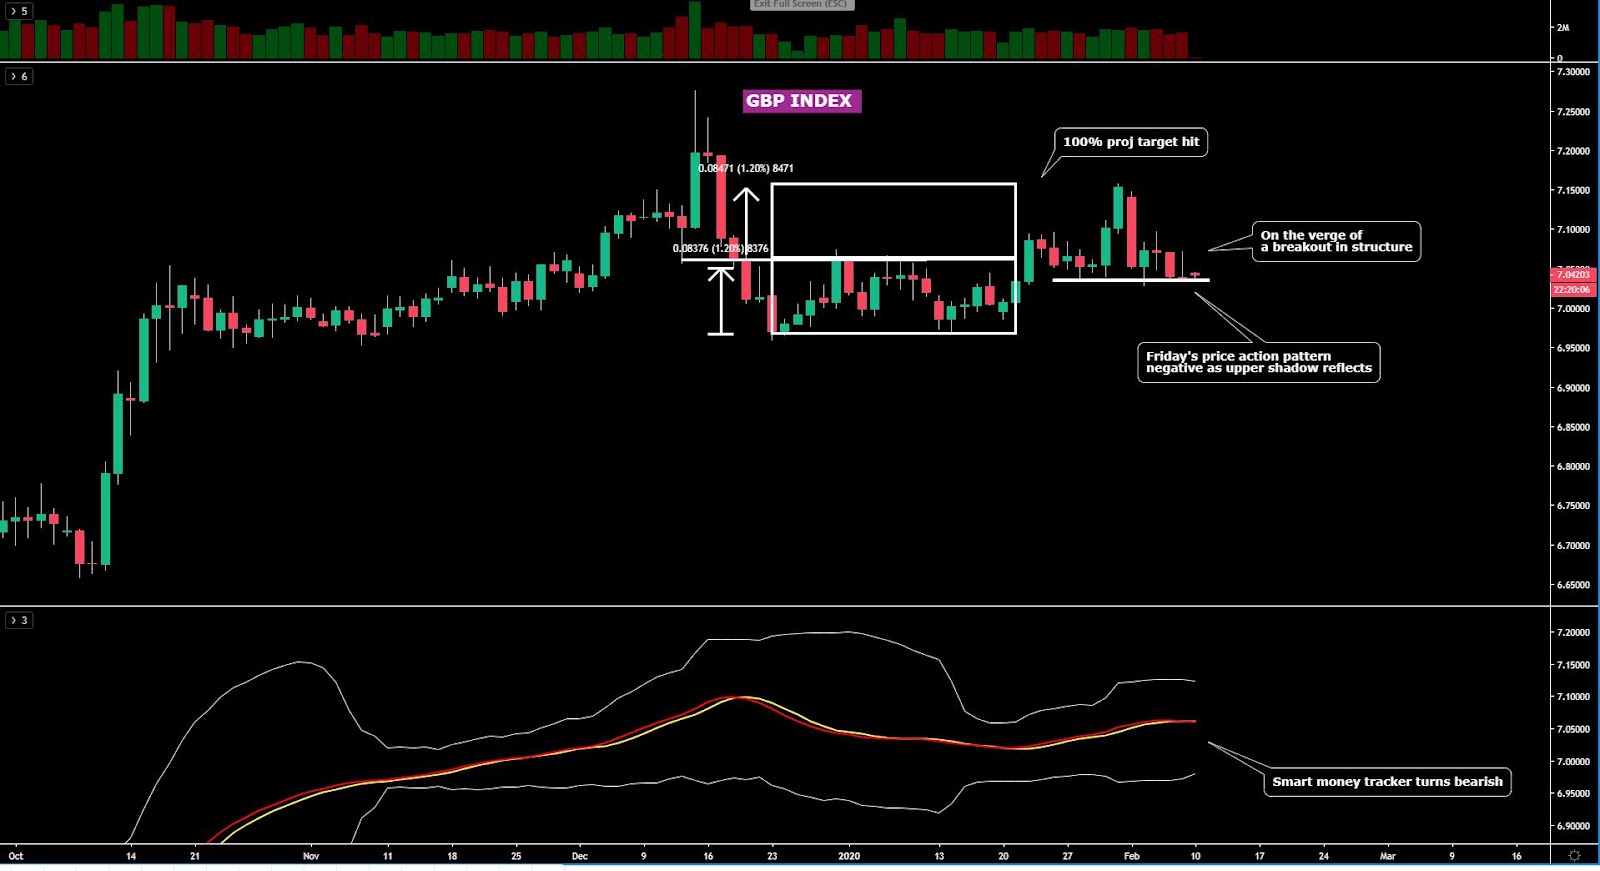
The GBP index is on the verge of a key breakout in structure, and the price action seen last Friday, if anything, strengthens the case for a breakout of the price structuve. The failure to maintain the bullish gains on Friday, with the end net result being an upper shadow, is a reflection that pressure keeps building up for an ultimate breakout lower that would validate, upon a daily close below the support, a fresh bearish cycle. The establishment of a new bearish cycle, if/when confirmed, would allow further room lower, to the tune of 0.9%-1%.
(Click on image to enlarge)
The USD index, on the back of the well-telegraphed technical breakout of a resistance last week, has gathered further steam to the upside, with Friday’s price action a strong statement of intent. Be aware, while scalping-type strategies may continue to see the currency as providing long-side opportunities intraday, the USD is at risk of shallow setbacks as the technical movement looks rather overstretched in the near term. The last impulsive move up in the currency comes stimulated by a strong US NFP, allowing the breach of another significant target completion after the extension towards the double top seen through Nov last year. I’ve marked in the chart below the next logical level of resistance where buyers may set the sight next.
(Click on image to enlarge)

The CAD index, notwithstanding the 4 straight days of gains, still retains a bearish profile off the daily chart. Either we look at the price structure or at the smart money tracker, both still point to risks skewed towards the downside. It is my base case that the buying pressure ends up petering out and sellers re-take control of the price action, despite I must acknowledge that the fundamental backing, after the positive surprise in the Canadian jobs, has debilitated. However, if risk-off dynamics pick up further momentum, with Oil exposed to a breakout of $50, it may attract significant downside momentum in the CAD sell-side action, with a very juicy target far below the current price, in the form of the 100% projection target at the Dec double bottom.
(Click on image to enlarge)

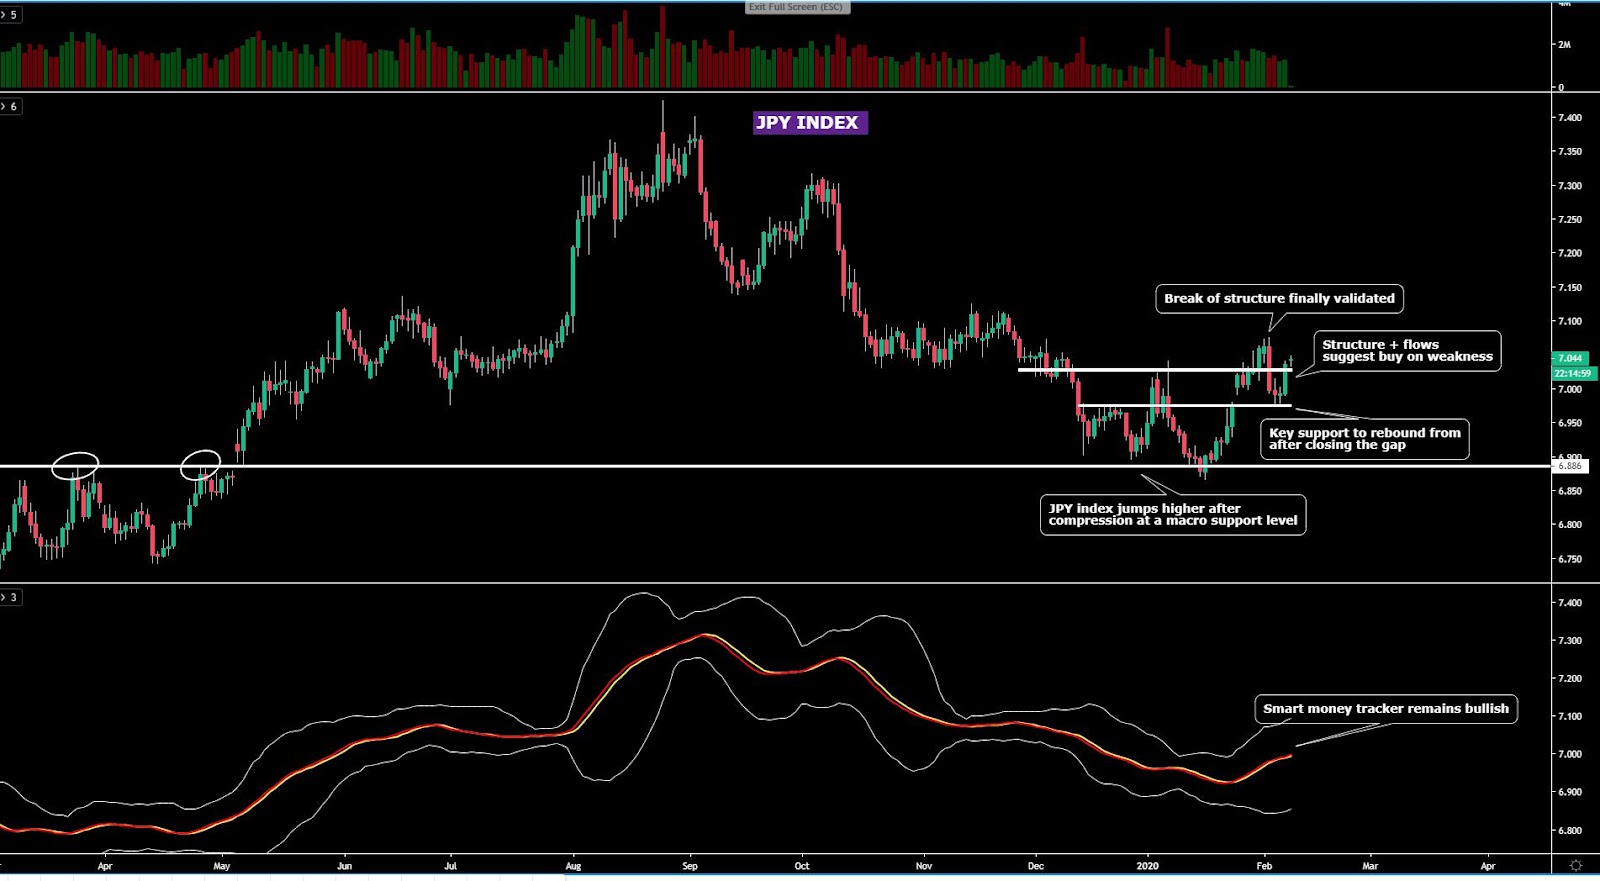
The JPY index, after materializing the closure of its up-gap from two weeks ago, found once again strong buy-side aggregated flows from an area where I warned these could return. What’s more, the bullish action falls in line with both the price structure in this market (higher highs), alongside the upward slope in the money tracker, hence why this is a rally with all the technical backing I’d like to see for an eventual retest of the previous highs. I’d be wary to add Yen short exposure at these levels as the daily pattern tends to be a powerful one for at least the recent trend high to be revisited in what I personally expect now to be another successful rotation up. The readership can find out more about this pattern in this video I created.
(Click on image to enlarge)
The AUD index, at this stage, is a market that as a default view off the daily, meets all the prerequisites to be sold on weakness. Before I unwrap the technicals into a deep dive, be aware that as I did warn, the level of resistance overhead acted as the reactionary level where sellers re-engaged in line with the dominant trend as the coronavirus fears fail to fully fade away. I told readers that by following the aggregated flows, which is what these charts reflect, there was a palpable risk of such resistance being an inflection point where a shift in order flow may occur. Venturing into longs in the Aussie does not have the backing of the price structure or the momentum, which I judge based on the smart money tracker. This is a market that is vulnerable to see further downside bias for a retest of the previous low as technicals stand.
(Click on image to enlarge)

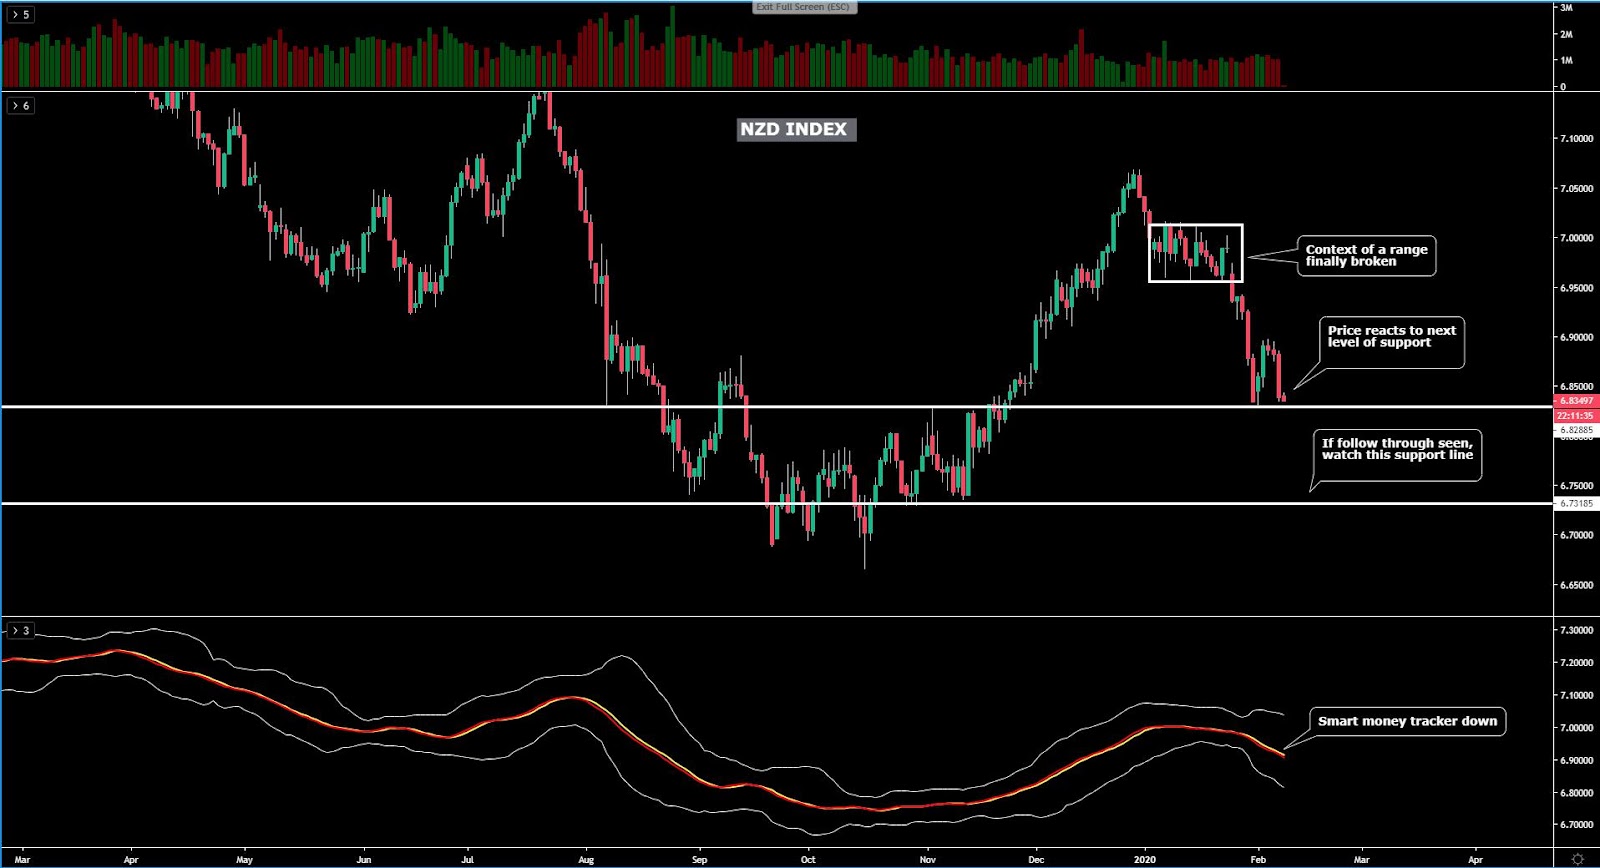
The NZD index is revisiting an area of key support. It’s not an ideal location to engage in shorts as it’s anyone’s guess how a retest of a previous swing low may play out. However, by looking at the tapering of tick volume on this second test lower, sellers are still not highly convinced. Therefore, the story line that I am reading here is that buying may continue to emerge off this line of strong support, even if I feel that’s a risky call because the environment has turned quite negative for the interest of commodity-linked currencies. Keep adding into NZD long exposure at your own risk I find would be an appropriate commentary here, especially on the basis that the price structure and the order flow via the smart money tracker imply the risk of more downside.
(Click on image to enlarge)
The CHF index, after a healthy pullback, printed a critica fractal pattern in the daily chart, which akin to what I've seen in the Yen chart, suggest that the market is now poised to see a potential retest of the previous trend high. The index remains in a clear uptrend and if recent history is any indication, the recent areas of previous resistance have reliably turned into support, which is what we are seeing once again as the architecture of the market screams buy on weakness. The bullish stance is aided by the ongoing bullish price structure as well as by the upward momentum via the smart money tracker, which has been guiding the index higher since the start of the year and it has yet to see a turn lower in the slope. Buyer keep ruling this market.
(Click on image to enlarge)

Important Footnotes
Market structure: Markets evolve in cycles followed by a period of distribution and/or accumulation. To understand the principles applied in the assessment of cycles, refer to the tutorial How To Read Market Structures In Forex
Horizontal Support/Resistance: Unlike levels of dynamic support or resistance or more subjective measurements such as Fibonacci retracements, pivot points, trendlines, or other forms of reactive areas, the horizontal lines of support and resistance are universal concepts used by the majority of market participants. It, therefore, makes the areas the most widely followed and relevant to monitor. The Ultimate Guide To Identify Areas Of High Interest In Any Market
Fundamentals: It’s important to highlight that the daily market outlook provided in this report is subject to the impact of the fundamental news. Any unexpected news may cause the price to behave erratically in the short term.
Projection Targets: The usefulness of the 100% projection resides in the symmetry and harmonic relationships of market cycles. By drawing a 100% projection, you can anticipate the area in the chart where some type of pause and potential reversals in price is likely to occur, due to 1. The side in control of the cycle takes profits 2. Counter-trend positions are added by contrarian players 3. These are price points where limit orders are set by market-makers. You can find out more by reading the tutorial on The Magical 100% Fibonacci Projection
The Daily Edge is authored by Ivan Delgado, Head of Market Research at Global Prime. The purpose of this content is to provide an assessment of the market conditions. The report takes an in-depth ...
more

