
Navistar Reports Better - But Still Bad - Results
Navistar International Corporation (NAV) is a holding company and its principal operating subsidiary is Navistar Int'l Transportation Corp. Navistar operates in three industry segments: truck; engine; and financial services. Its truck segment is engaged in the manufacture and marketing of medium and heavy trucks, including school buses. Its engine segment is engaged in the design and manufacture of mid-range diesel engines. The financial services operations consist of Navistar Financial Corp., its domestic insurance subsidiary and its foreign finance and insurance subsidiaries.
![]()
While some transportation companies might benefit from cheap gas and diesel, others suffer precisely because of the spillover effects of low energy prices. One of those troubled firms is Navistar. The company reported today and while the results were better, they were of the "narrowed loss" rather than "increased profit" variety.
Navistar reported a loss of $33 million, or $0.40/share, which was better than last year's loss of $42 million and $0.52/share, but still a loss. Overall revenue slipped 27% to $1.77 billion. This was a "beat" in one sense, analysts had expected losses in the range of $0.69/share.
Navistar suffered from the carnage in the domestic oil and gas production market and saw lower overall truck sales as a result. They also suffered--paradoxically--from the ongoing economic recovery as many trucking firms have been buying new vehicles and that trend may have peaked last year. So, lots of inventory remaining out there remains fewer sales for companies such as Navistar this year.
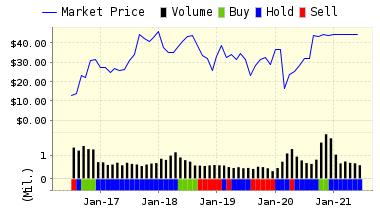
WE have been down on this company for a while. As you can see from the long-term chart below, our models have had a pretty consistent SELL position on the stock for several years.
Recommendation: We continues the SELL recommendation on NAVISTAR INTL for 2016-03-07. Based on the information we have gathered and our resulting research, we feel that NAVISTAR INTL has the probability to UNDERPERFORM average market performance for the next year. The company exhibits UNATTRACTIVE Momentum and Sharpe Ratio.
|
ValuEngine Forecast |
||
|
Target |
Expected |
|
|---|---|---|
|
1-Month |
11.65 | -0.92% |
|
3-Month |
11.32 | -3.73% |
|
6-Month |
10.83 | -7.94% |
|
1-Year |
10.47 | -11.00% |
|
2-Year |
7.17 | -39.06% |
|
3-Year |
6.00 | -48.95% |
|
Valuation & Rankings |
|||
|
Valuation |
65.83% undervalued |
Valuation Rank |
|
|
1-M Forecast Return |
-0.92% |
1-M Forecast Return Rank |
|
|
12-M Return |
-60.62% |
Momentum Rank |
|
|
Sharpe Ratio |
-0.76 |
Sharpe Ratio Rank |
|
|
5-Y Avg Annual Return |
-39.95% |
5-Y Avg Annual Rtn Rank |
|
|
Volatility |
52.25% |
Volatility Rank |
|
|
Expected EPS Growth |
212.28% |
EPS Growth Rank |
|
|
Market Cap (billions) |
0.96 |
Size Rank |
|
|
Trailing P/E Ratio |
n/a |
Trailing P/E Rank |
|
|
Forward P/E Ratio |
10.80 |
Forward P/E Ratio Rank |
|
|
PEG Ratio |
0.06 |
PEG Ratio Rank |
|
|
Price/Sales |
0.09 |
Price/Sales Rank |
|
|
Market/Book |
n/a |
Market/Book Rank |
|
|
Beta |
2.59 |
Beta Rank |
|
|
Alpha |
n/a |
Alpha Rank |
|
Market Overview
|
Summary of VE Stock Universe |
|
|
Stocks Undervalued |
60.95% |
|
Stocks Overvalued |
39.05% |
|
Stocks Undervalued by 20% |
26.12% |
|
Stocks Overvalued by 20% |
12.1% |
Sector Overview
|
Sector |
Change |
MTD |
YTD |
Valuation |
Last 12-MReturn |
P/E Ratio |
|
Consumer Staples |
0.02% |
3.29% |
1.69% |
5.76% overvalued |
-0.18% |
23.14 |
|
Basic Materials |
2.95% |
12.04% |
15.48% |
5.08% overvalued |
-7.50% |
26.53 |
|
Utilities |
0.56% |
3.94% |
4.66% |
4.50% overvalued |
-2.89% |
23.29 |
|
Multi-Sector Conglomerates |
0.63% |
7.94% |
1.84% |
2.76% overvalued |
-14.55% |
19.51 |
|
Industrial Products |
1.52% |
7.14% |
1.76% |
2.65% overvalued |
-13.88% |
18.43 |
|
Oils-Energy |
2.41% |
15.20% |
5.17% |
2.30% undervalued |
-36.48% |
22.80 |
|
Computer and Technology |
0.46% |
4.09% |
2.25% |
2.57% undervalued |
-9.34% |
26.32 |
|
Aerospace |
0.02% |
2.92% |
-4.20% |
3.78% undervalued |
-10.98% |
19.95 |
|
Business Services |
0.39% |
4.49% |
-1.31% |
4.91% undervalued |
-11.05% |
21.58 |
|
Finance |
0.58% |
4.44% |
-3.26% |
5.58% undervalued |
-7.33% |
15.53 |
|
Consumer Discretionary |
0.58% |
3.77% |
-0.52% |
5.60% undervalued |
-8.55% |
24.45 |
|
Retail-Wholesale |
0.75% |
4.47% |
0.69% |
6.79% undervalued |
-12.13% |
22.52 |
|
Auto-Tires-Trucks |
1.68% |
10.61% |
-0.87% |
9.32% undervalued |
-19.51% |
12.31 |
|
Construction |
0.74% |
4.92% |
-0.46% |
9.39% undervalued |
-6.57% |
18.83 |
|
Transportation |
1.88% |
6.87% |
0.45% |
11.59% undervalued |
-22.82% |
12.85 |
|
Medical |
1.77% |
5.65% |
-9.30% |
12.31% undervalued |
-23.20% |
26.35 |
Valuation Watch: Overvalued stocks now make up 60.95% of our stocks assigned a valuation and 12.1% of those equities are calculated to be overvalued by 20% or more. Five sectors are calculated to be overvalued.
Disclosure: None.
Disclaimer: ValuEngine.com is an independent research provider, producing buy/hold/sell recommendations, ...
more

