
Natural Gas Forecast: Continuing To Levitate
Natural gas markets have been very noisy during the trading session on Thursday, as the inventory figures came out much more bullish than anticipated. However, there is a gap underneath it still needs to be filled so therefore it makes a certain amount of sense that the market ended up pulling back. Filling this gap shows that we could very well continue going higher. One thing that’s worth noting, we are starting to see snow in parts of the heavily populated region of the United States, and at this point, it’s likely that the demand should continue to drive this market to the upside.
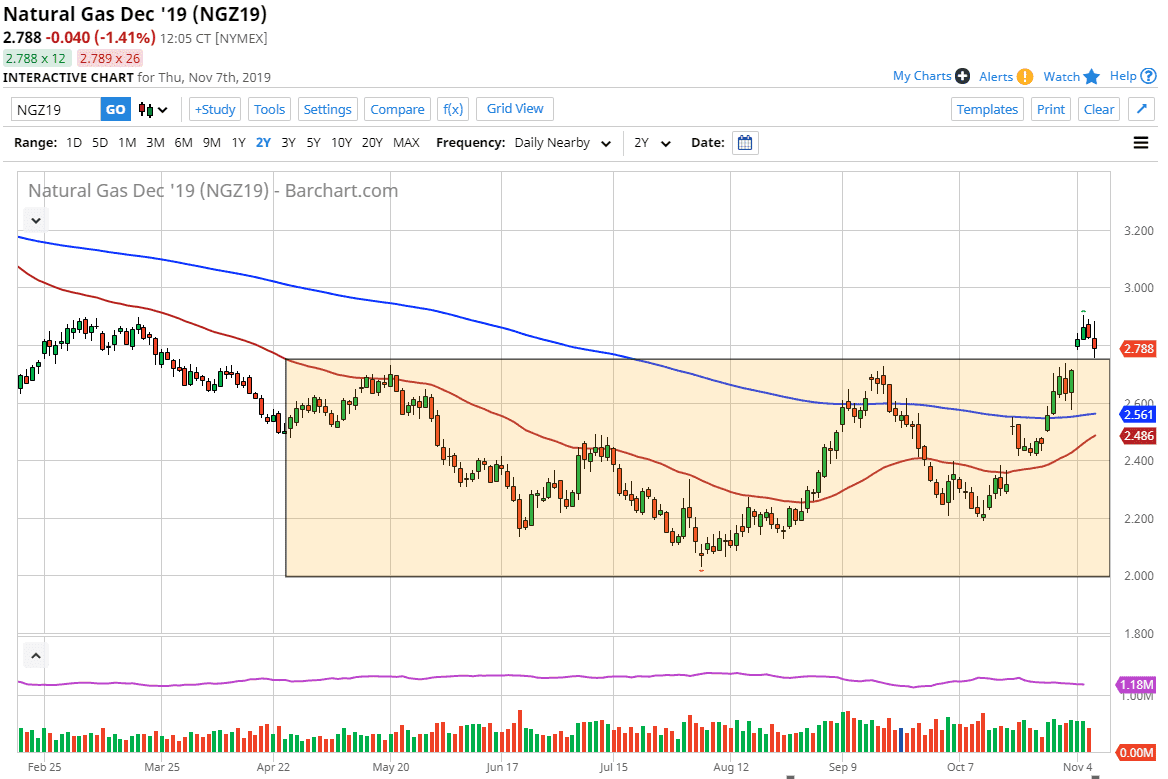
Looking at this chart, you can see that the market had broken above the consolidation area, which has a resistance barrier at the $2.75 level. That resistance barrier now should offer plenty of support and we have in fact seen a bit of a bounce from that level. It looks as if the market is ready to go looking towards the $3.00 level above, which of course is a large, round, psychologically significant figure. Ultimately, this is a very bullish sign, and as we are reaching the coldest time of year in America, which of course coincides with more demand for the commodity.
To the upside, the $3.00 level above will be a major target to take advantage of and will attract a lot of attention. If we can break above that level, then the market is free to go much higher. I do think we eventually get above the $3.00 level, but we may get a short-term pullback as we percent level. Once we do break above the $3.00 level, the market is likely to go looking towards the $3.20 level, and then possibly even the $3.50 level after that. Keep in mind that the market does tend to be erratic and moves on the weekly weather reports coming out of the US, but all things being equal we should now be in an uptrend for the next couple of months, until just after New Year’s Day when traders will start to focus on spring contracts which of course will mean less demand for natural gas. Buying the dips should continue to work, with the 200 day EMA, pictured in blue on the chart, underneath offering a hard “floor” in the market and should remain a trend defining indicator for traders.
(Click on image to enlarge)
Disclaimer: DailyForex will not be held liable for any loss or damage resulting from reliance on the information contained within this website including market news, analysis, trading signals ...
more

