
Nasdaq Vs Dow Outperformance
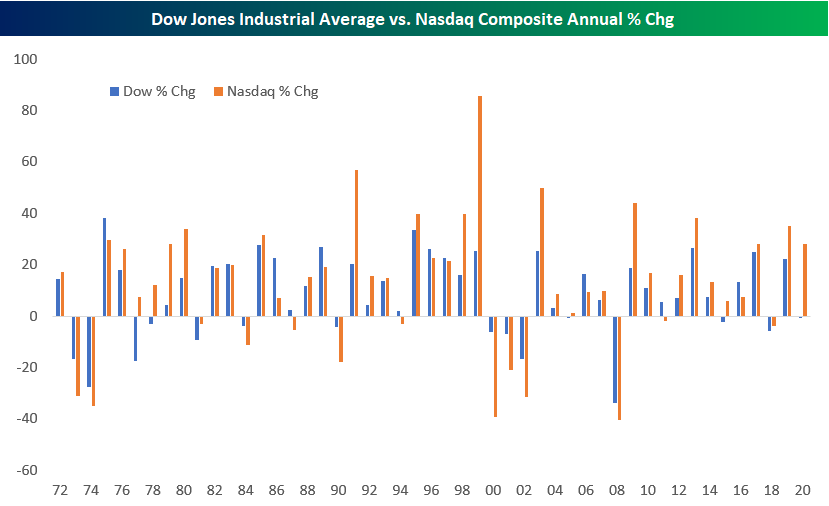
You may not realize it, but while the Tech-heavy Nasdaq Composite (COMP) is up a ridiculous 28% so far in 2020, the Dow Jones Industrial Average (DIA) is still in the red on the year.
Below is a table showing the Dow and Nasdaq’s annual percentage change since 1972 when the Nasdaq came into existence. Were the year to end now, the Nasdaq would be outperforming the Dow by 28.65 percentage points. This would be the third strongest outperformance for the Nasdaq on record and the strongest since 1999 when the spread was 60 percentage points!


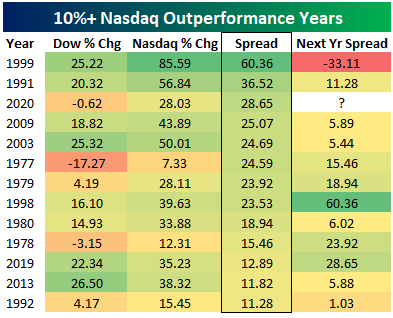
Below are all years since 1972 in which the Nasdaq outperformed the Dow by at least ten percentage points. The Nasdaq has posted an annual gain of 20%+ in seventeen different years, but never in a year when the Dow was in the red. Probably the year that most resembles 2020 in terms of the performance spread is 1979 when the Nasdaq rose 28.11% and the Dow rose just 4.19%. Following that year in 1980, both the Dow and Nasdaq surged again and the Nasdaq outperformed by another 18.9 percentage points.
Interestingly, of the twelve years where the Nasdaq outperformed the Dow by more than ten percentage points, the Nasdaq went on to beat the Dow again in the next year eleven out of twelve times. The only time we’ve seen the Nasdaq crumble versus the Dow in the following year was in 2000 after 1999’s outperformance. In 1999, the Nasdaq beat the Dow by a humongous 60 percentage points. After that large gap, though, the Nasdaq ran out of gas in 2000 and underperformed the Dow by 33 percentage points when the Dot Com Bubble finally burst.
Disclaimer: For more global markets and macroeconomic coverage, make sure to check out Bespoke’s Morning Lineup and nightly Closer notes, as well as our ...
more

