
Nasdaq Heating Up? Weekly Nifty 9
Research Report Excerpt #1
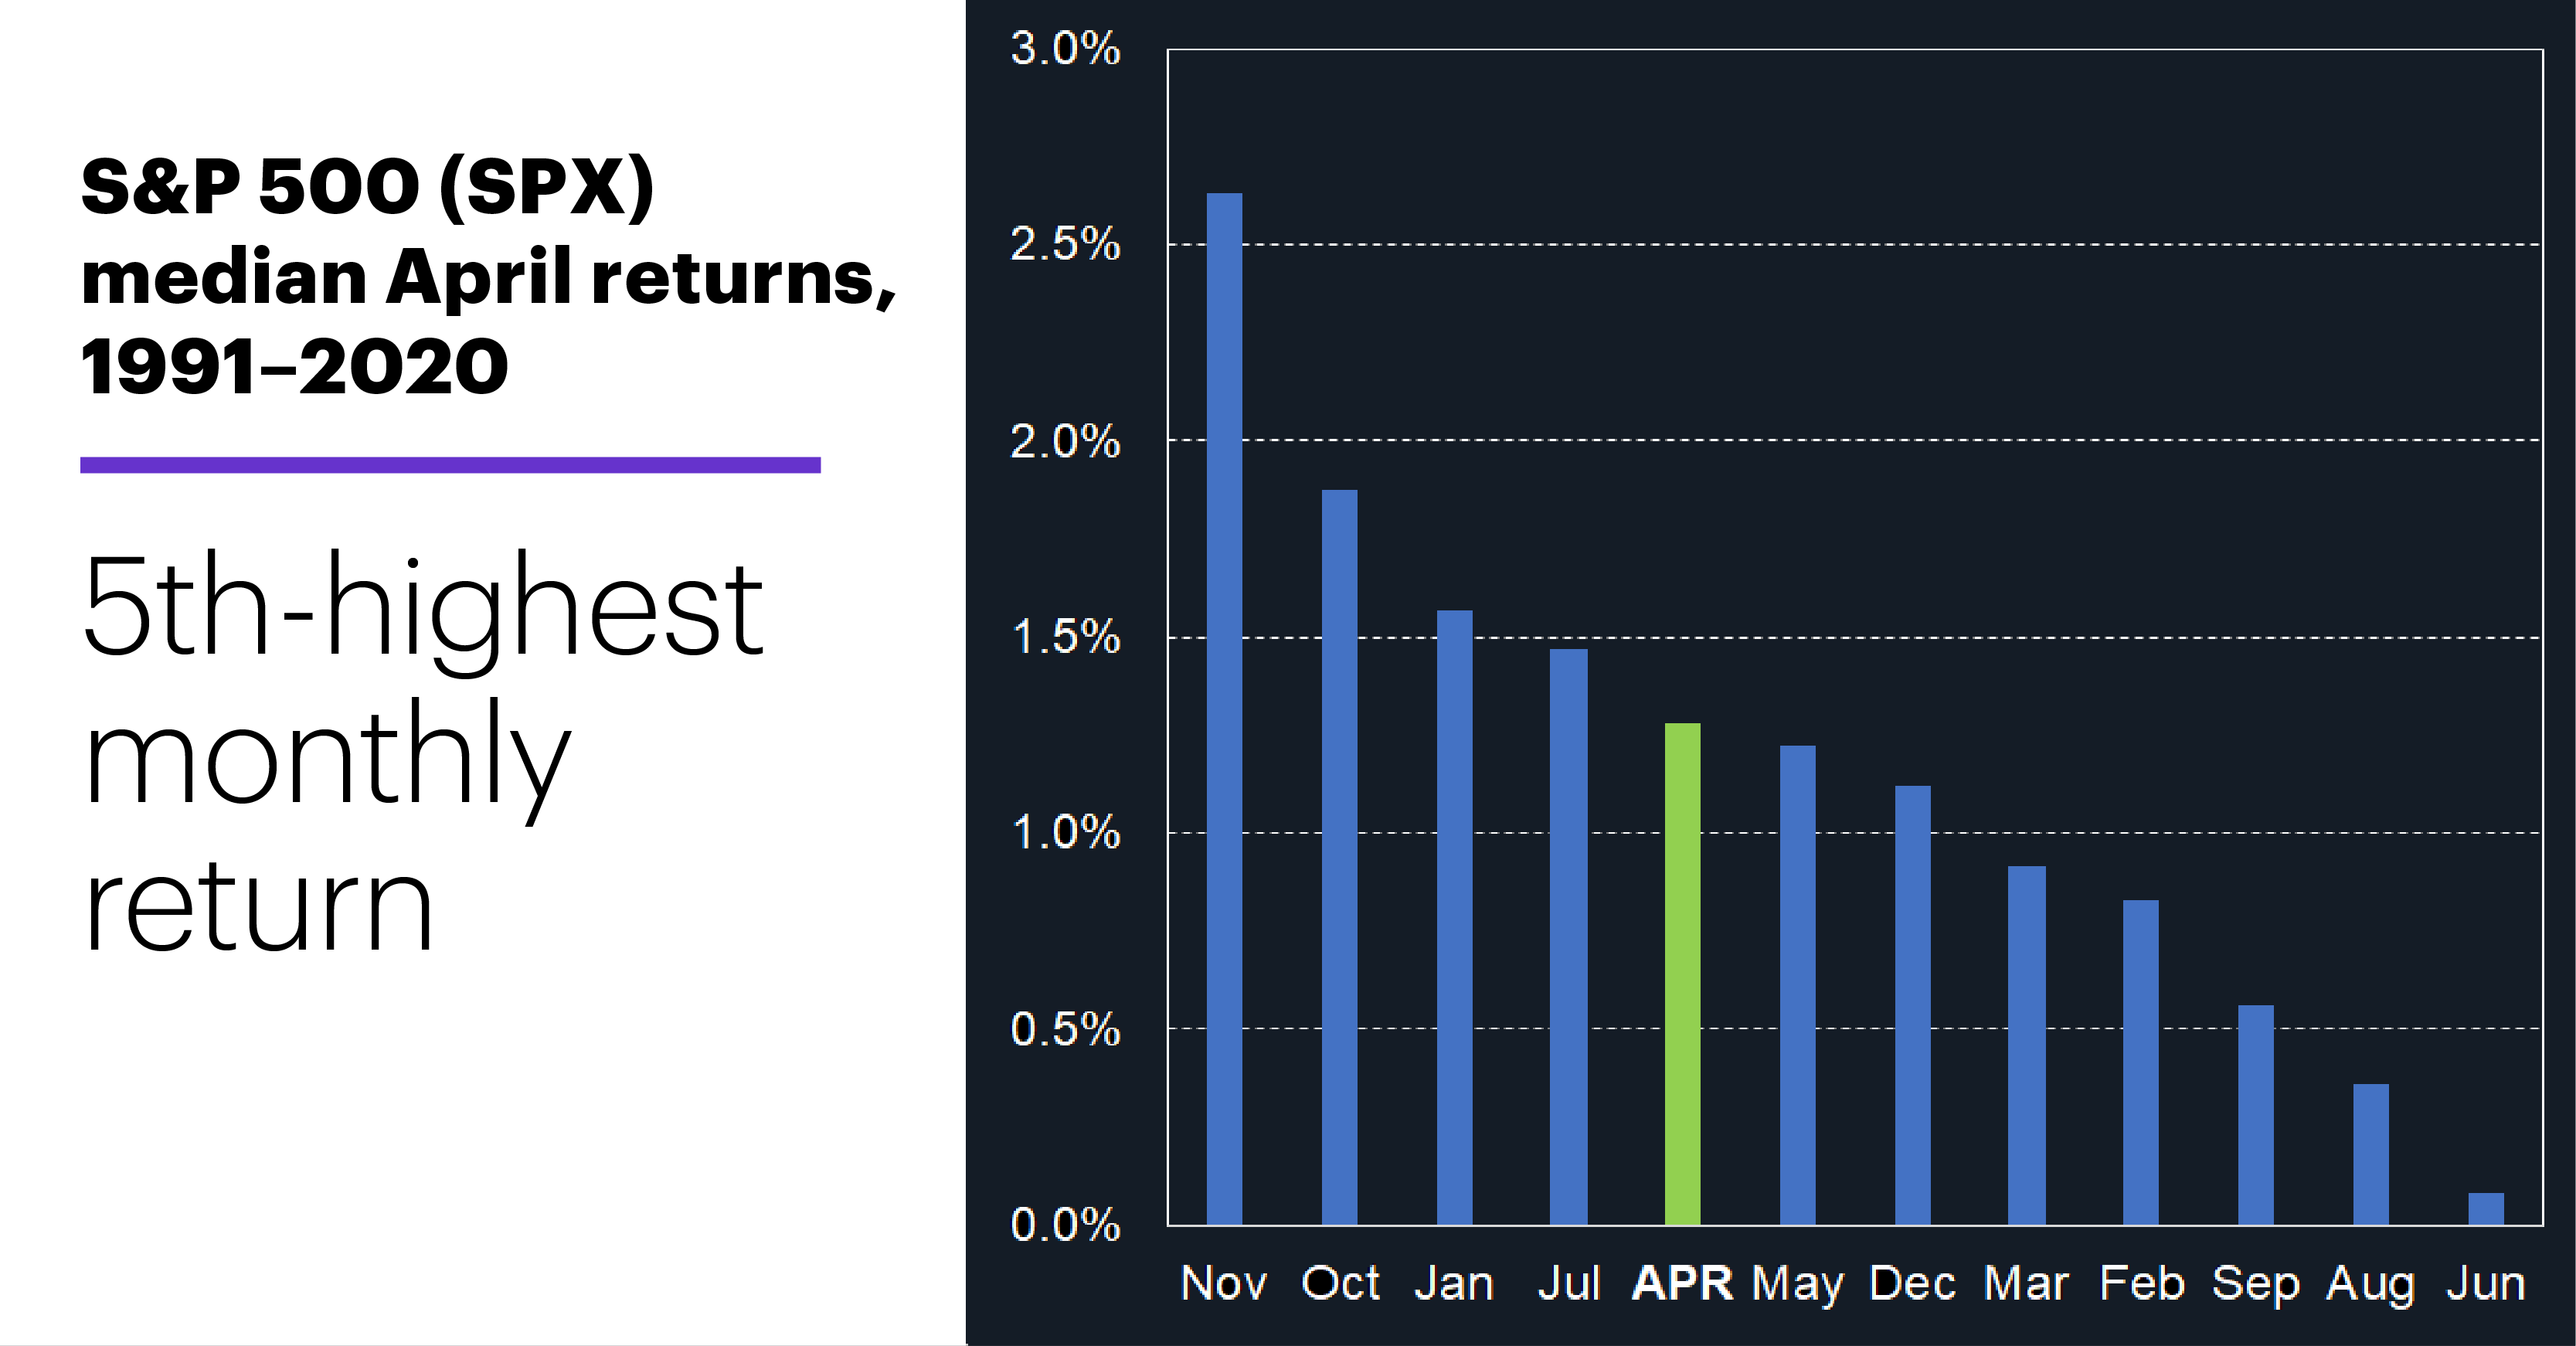
The typical April return has been good, but not great. Over the past 10 years, April has been only the eighth-strongest month of the year, with a 0.9% median SPX return. Since 1991, though, the median April return has been 1.3%—the fifth-best month of the year:1
Research Report Excerpt #2
Just so we’re clear, Finom Group is not forecasting a 10%+ correction, we’re simply outlining the probabilities and encouraging investors/traders to maintain and/or adopt appropriate expectations. Truth be told, a double-digit correction in Q2 2021 would prove quite the opportunity with respect to the average year 2 gains of a new bull market cycle, at 16.9 percent. Let that sink in for a second and do the math…
7% YTD + – 10% = -3%
-3% + 19.9% = 16.9%
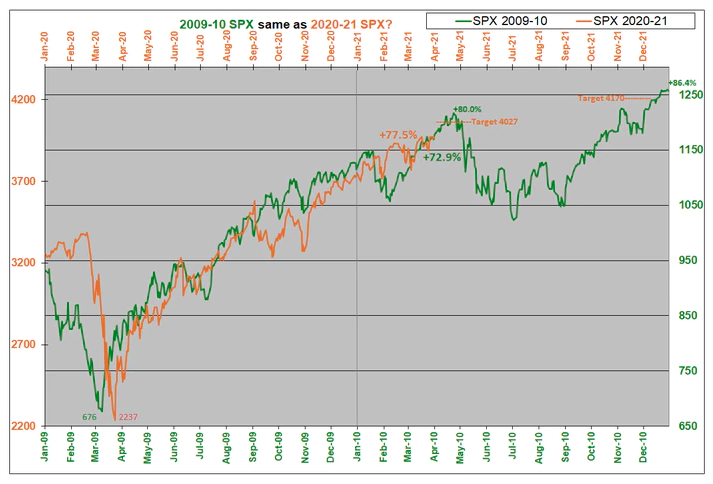
Speaking of analogues, or making a segue, while the current SPX is in nearly perfect sync with the 2009-10 Roadmap, it remains more than 4 percentage points above it because it started at a lower point coming out of the bear market. It still appears that it may encounter some upside resistance near-term, just about the time Q1 earnings season gets underway. But as always, past performance is certainly no guarantee of future results. Remain flexible and open to a wide variety of outcomes, even as the analogue has proven a tremendous guide.
Research Report Excerpt #3
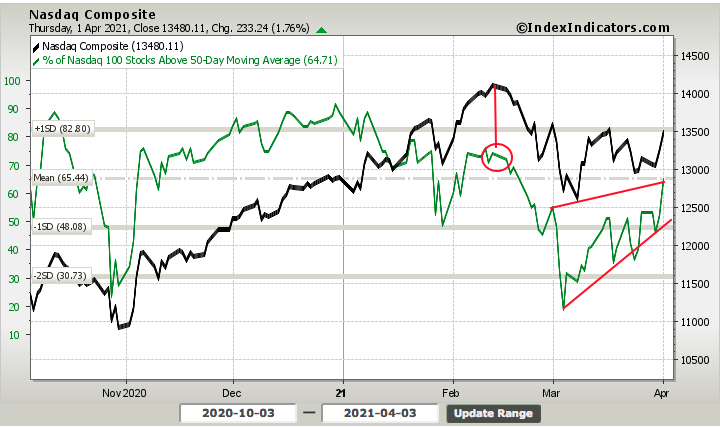
In using breadth indicators to suggest the potential for more upside near-term in the Nasdaq, I think we can look at the percentage of stocks trading at 10-day highs, which is a strong impulse indicator for the Nasdaq given its high beta composition (high-beta equates to larger expected moves). After corrective periods in the past, we have seen this particular indicator achieve higher levels than it currently holds and within an uptrend.
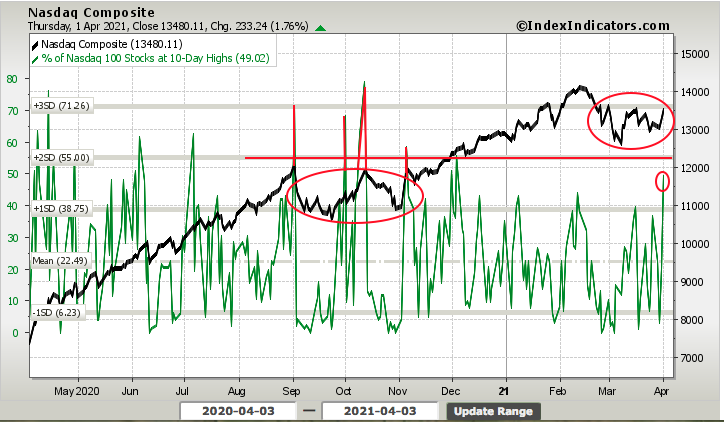
The previous corrective Nasdaq wave looks similar to that of today (large red circles). When the Nasdaq rallied within and coming out of the corrective period from September to October 2020, this breadth indicator surged above 55 percent. If indeed there is more upside to come and the worst of the corrective wave is in the rear-view mirror for the Nasdaq, we would expect this indicator to rise at least another 6 percentage points in the next week or two.
Research Report Excerpt #4
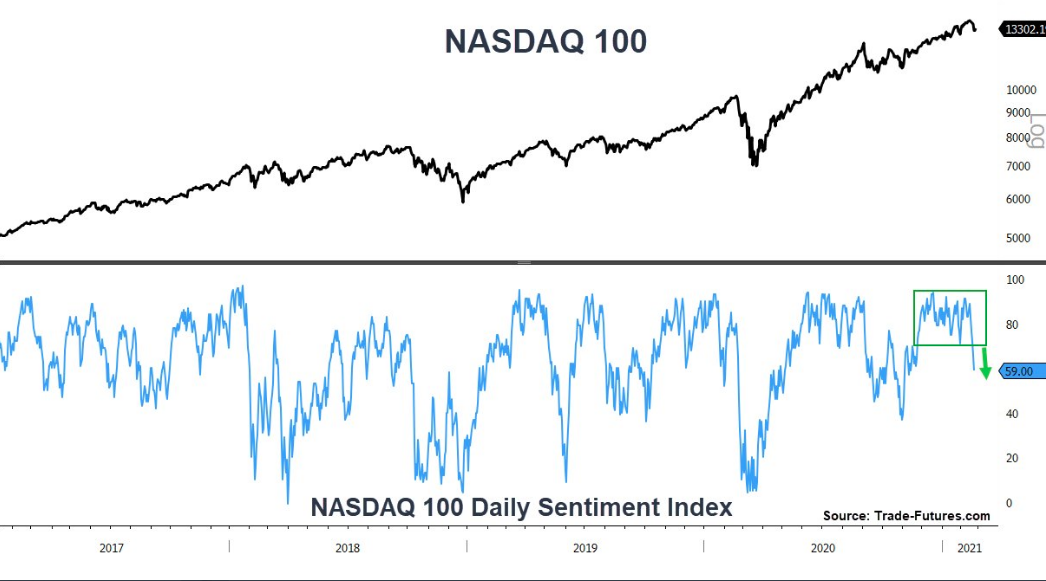
Least we also forget about another Nasdaq signal that fired near the very end of February…
The Nasdaq Daily Sentiment Index fell below 60 for the first time in more than 3 months toward the end of February. Historically, long streaks of elevated sentiment always led to more gains for the Nasdaq over the next 3 months.
What we care mostly about, however, is how the index performs after the DSI falls below 60 for the first time in at least 3 months. Here are the results, based on a recent study from Troy Bombardia:
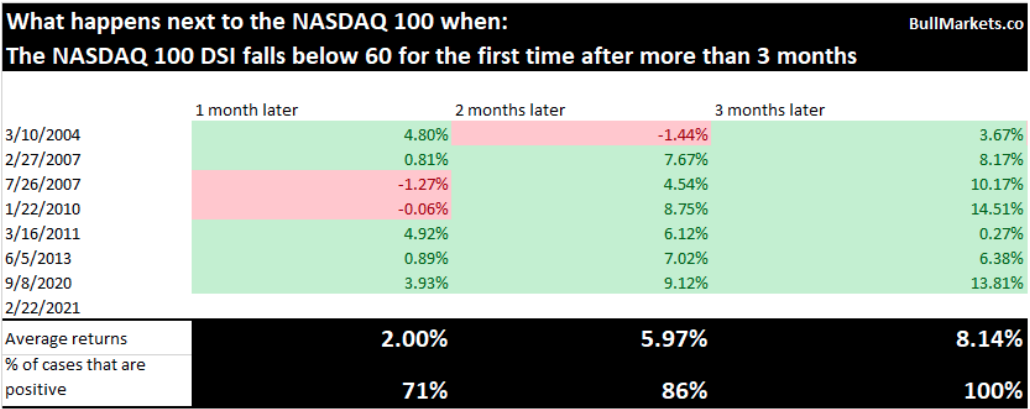
While we didn’t see the Nasdaq higher from February to March, the 2-month period offers a greater positivity rate and potential average return after this sentiment signal fires, 86% and 5.97% respectively.
Research Report Excerpt #5
Finom Group actually discussed and analyzed higher taxes ahead of the 2020 Presidential Election in our Special State of the Market video. Time to revisit that video to get a fact-based understanding of the potential tax implications on the earnings picture for the investor community I think! Here is what we outlined in October of 2020, regarding the probable and now realized Biden tax proposals:

- Trump corporate tax cut took the rate from 35% down to 21%, with effective rate at 17.7% (decline of 6.6% from previous effective tax rate).
- Biden’s proposed corporate tax hike would erase half of that, back to 28%.
- Effective is different from the stated tax rate. You can see in the table above that while the current corporate tax rate is 21%, the effective reported tax rate is 17.7% since late 2017
- Principally, if we use the stated tax rate for Biden’s increase to 21%, after-tax income comes in with a decline of 12.7%… but…
- … At the effective tax rate, however, the drop is only -4.2%.
- My contention is that Congress will never do it. They have been bought off many times over and Pelosi’s comments back then hints that Biden is going to have a tough time with anything beyond a token tax raise.
As we can see, the impact from a higher corporate tax rate is limited based on the basic math, and distinguishing between the corporate tax rate and effective tax rate, which gets lost by the media’s narrative.
Research Report Excerpt #6
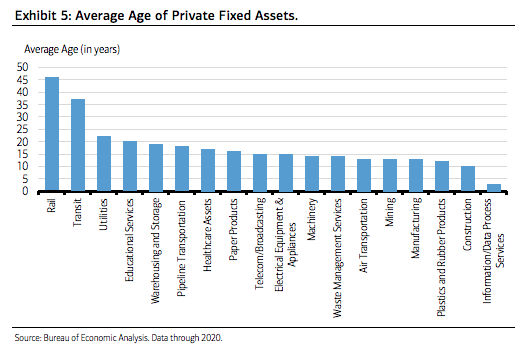
In the U.S. we definitely focus a great deal of attention on consumer spending, given its the largest component of economic activity/GDP. While there’s much said about consumer spending, less is said about business spending, which in our view, could deliver its own boost to growth. From August through January, orders for capital goods posted the strongest six-month annualized growth rate dating back to 1992. Since the starting point matters, it’s worth pointing out the coronavirus CAPEX-related decline was shallower than most expected, and the recovery has been quicker. Sitting on corporate balance sheets for S&P 500 companies, total cash holdings and short-term investments, grew to $2.2 trillion, with the Technology and Industrial sectors the most cash flush, according to Bloomberg. The pandemic and its aftermath support a new cycle of business investment. New orders for non-defense capital-goods orders ex-aircraft reached a new high in January, on a clear upswing since April 2020. This coincides with the Business Roundtable CEO Confidence survey suggesting CAPEX plans are to rise sharply in 2021. “New-economy” CAPEX levered to the digital component of the economy is set to continue rising over this year. This means new investment in telecom and data processing services as examples of “new economy” alongside the machinery and transit hallmarks of “old economy” all in need of replacement (Exhibit 5). In addition, any of the supply chain reconfiguration and onshoring buzz complement the outlook, as does, of course, the U.S. infrastructure bill crafted in Washington. As we have outlined before, we believe the U.S. is on the cusp of a super-cycle in infrastructure spending, which will be highly supportive of rising levels of CAPEX spending.
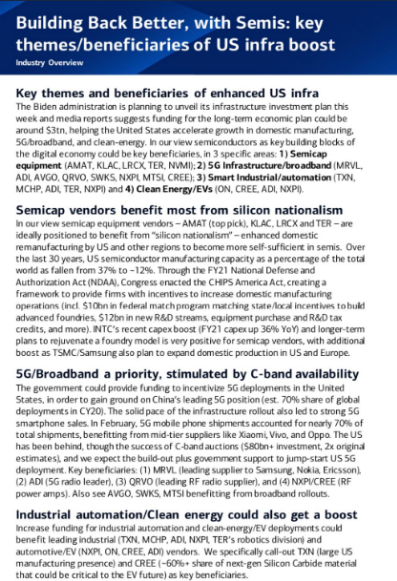
Bank of America’s Global Research team is also a big believer in the CAPEX cycle and who will prove the greater beneficiaries of corporate spending. In short, the firm characterizes the infrastructure play as being inherently a CAPEX play, which is inherently a tech play, but with some clean energy and industrial tech intermingled.
Research Report Excerpt #7
Joining the recent parade of higher EPS estimates/models is Dr. Ed Yardeni. In his recent LinkedIn blog, the famous former Deutsche Bank analysts offered the following:
I am raising my S&P 500 operating earnings forecast for 2021 from $175 per share to $180, a 27.8% y/y increase from 2020. I am also raising my 2022 forecast from $190 to $200, an 11% increase over my new earnings target for this year. I would have raised my 2022 estimate more but for my expectation that the Biden administration will raise the corporate tax rate next year.
As I’ve observed, the economy was hot before the third round of “relief” checks started going out around mid-March. Now it is likely to turn red hot as the Treasury sends $1,400 checks or deposits to 285 million Americans in coming weeks.
I have also observed that the average of the business activity indexes compiled by the Federal Reserve Banks (FRBs) of New York and Philadelphia for their districts jumped from 17.6 during February to 34.6 during March, the highest reading since July 2004 (Fig. 1). This is a very significant development for the following reasons:
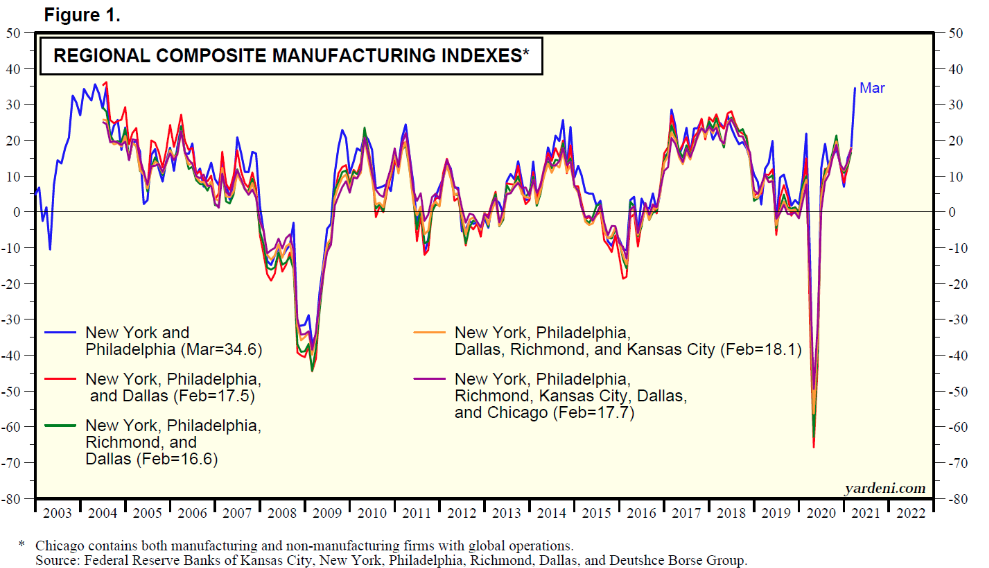
(1) Regional and national business surveys. Their average tends to be a good leading indicator for the average of the five surveys conducted by these two FRBs along with the ones in Richmond, Kansas City, and Dallas. The average of the five business activities indexes is highly correlated with the national M-PMI (Fig. 2). That means that the average of the New York and Philly indexes also is highly correlated with the national M-PMI and is signaling a solid number for the latter’s March reading (Fig. 3).
Research Report Excerpt #8
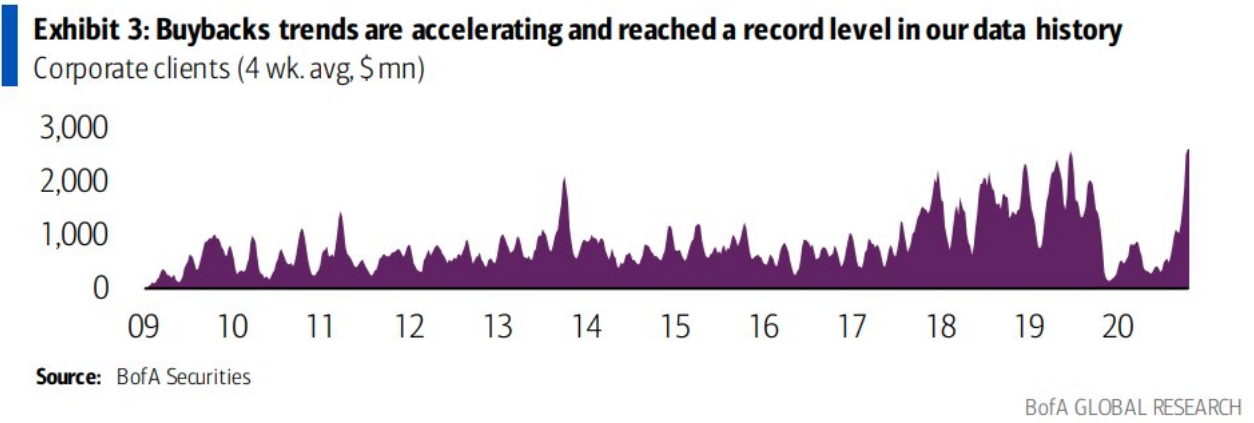
Spending will continue to remain strong for a variety of reasons: Relief, Revenge and Reunion spending 1. Relief spending in the form of dining out or returning to in-person shopping; 2. Revenge spending, or taking the time off employees never took in 2020 for vacations and 3. Reunion spending; spending on planes and trains to see friends and family. When combined with CAPEX spending that we anticipate/expect in 2021 and before even considering the healthy ramp-up in corporate buybacks, we continue to see the greater probability of higher market prices in 2021, as earnings move higher into 2022.
Research Report Excerpt #9
Moreover, let’s not lose sight of some of our more recent quantitative studies from mid-February, which were offered in a special Weekend Mashup article:
- The Valentine’s Day Indicator: Average return since 1950 for S&P 500 from 2/14 until end of year is 7.5%.
- BUT… if up >4% YTD on 2/14, it jumps up to 13% rest of year.
- The S&P 500 finished up 5.3% YTD as of Friday and the last trading day before Valentine’s Day.
- The S&P 500 has had 2 consecutive double-digit annual returns. This is yet another piece of historic data pointed in favor of double digit returns.
Disclaimer: The risk of loss in stock, stock/options, futures, futures/options, and forex trading is substantial, and site visitors and subscribers should consider whether trading these markets ...
more

