
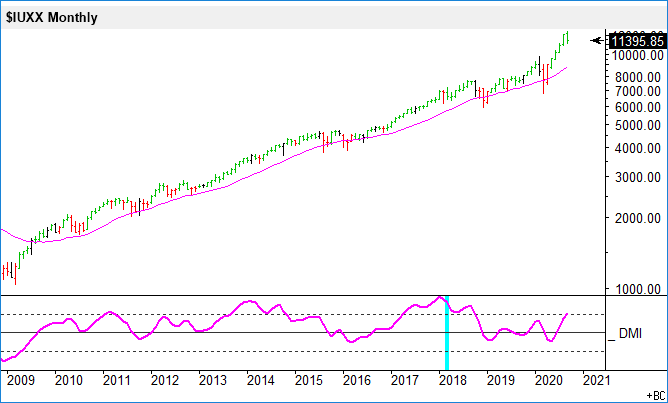
The first chart shows the Nasdaq 100 index using monthly data and a semi-log scale. The index probably has moved too far above its moving average line and may correct back to it over the next few months, either through price or time.
(Click on image to enlarge)
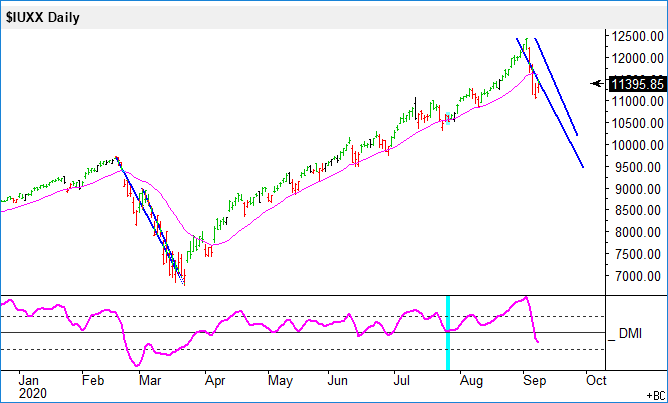
On a daily, if the index stays below the moving average and closes convincingly below 11.000, then I expect lower index levels. My two potential targets would then be 10.250-9.500.
(Click on image to enlarge)

Comments
Log in or sign up to join the conversation.