
Nasdaq 100 Forecast: Showing Support At Bottom Of Channel
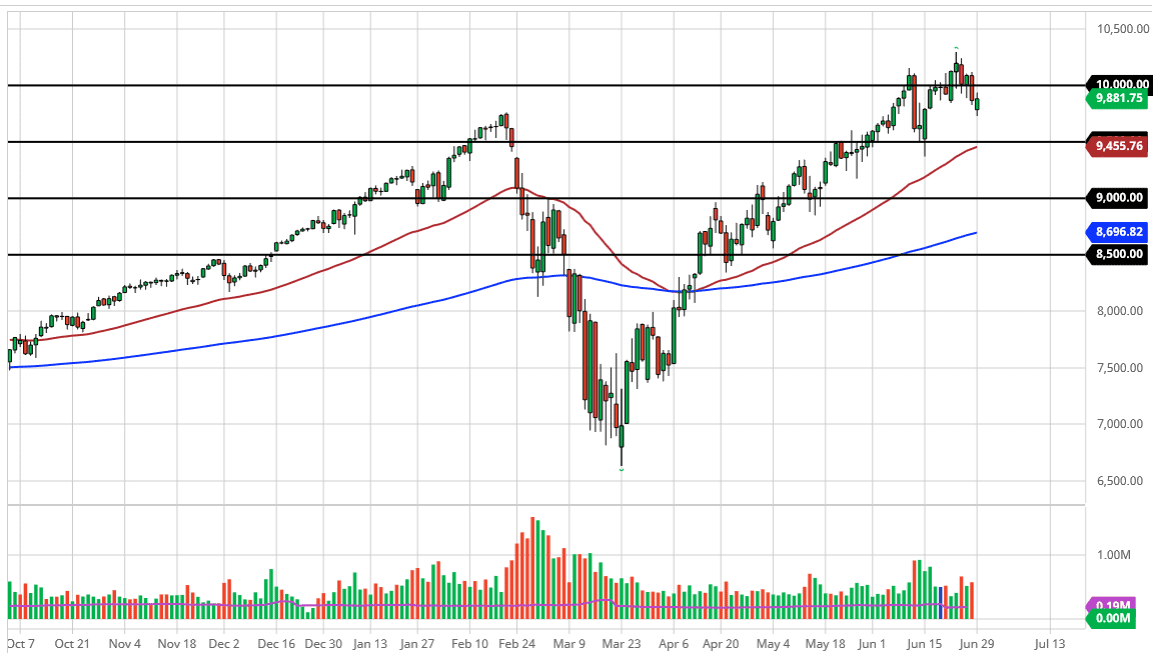
The Nasdaq 100 gapped lower to kick off the trading session on Monday, dropped a bit, but then found buyers underneath at what would be the bottom of the overall channel. At this point, the market is likely to go looking towards the 10,000 level, and then perhaps break above there. This has been a relentless channel, and it has still shown itself to be resilient. At this point in time, it is still holding and therefore we could see a bit of bullish pressure during the rest of the week.
Even if we did break down below here, the 9500 level underneath would be supportive, as the 50 day EMA is sitting in that general vicinity as well. The 50 day EMA has been incredibly supportive in general, as it has been sitting just below that potential uptrend line. The up trending channel is a perfect 45° channel, and therefore it is a strong sign. The Nasdaq 100 of course continues to have the benefit of being lifted by some of the most favored stocks in the world, including Facebook, Amazon, Alphabet, Microsoft, and Netflix. Ultimately, that in and of itself is about 33% of the index, and then after that we also have companies like Intel and Tesla. In other words, it is difficult to imagine that this index is going to dropped significantly.
If we did break down below the 50 day EMA then it opens up a move down to the 9000 level which is even more supportive. While I do not think that is going to happen, the reality is that it would of course be a significant 10% pullback, something that a lot of Wall Street types look for in order to find value. To the upside, if we were to break above the all-time highs then we will simply grind back and forth going much higher. I think that the 11,000 level would be targeted, perhaps followed by the 12,000 area. The candlestick for the trading session is somewhat bullish, and a break above the top of the candlestick certainly would kick in more buying. The fact that we gapped lower and then turned around to fill it and continue going higher is typically a good sign for a market as it shows a breakdown, followed by a breakout of micro support and resistance.
(Click on image to enlarge)
Disclaimer: DailyForex will not be held liable for any loss or damage resulting from reliance on the information contained within this website including market news, analysis, trading signals ...
more

