
Nasdaq 100, DAX 30, Nikkei 225 Technical Forecasts
NASDAQ 100 TECHNICAL FORECAST
Outlook: Neutral
Global risk assets enjoyed notable gains last week, a recovery that is somewhat remarkable given the underlying fundamental developments. In any case, the Nasdaq 100 has outperformed the Dow Jones and S&P 500 in recent weeks and enjoys a stronger standing from a technical perspective as a result. Now, the tech-heavy index will have to surmount resistance if it is to continue higher in the week ahead.
NASDAQ 100 DAILY PRICE CHART (FEBRUARY 2018 – MARCH 2020)
(Click on image to enlarge)
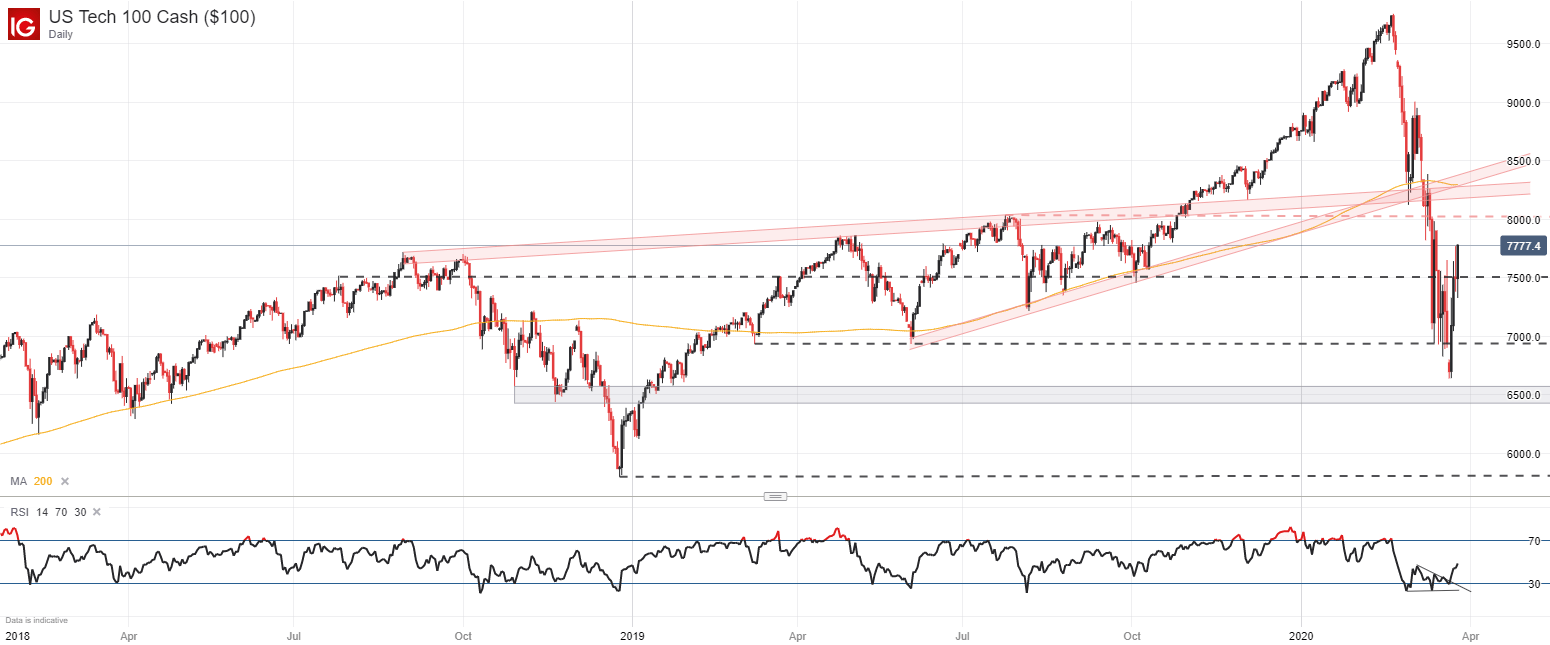
Standing in its way is a plethora of resistance overhead. First is the psychological 8,000 mark, followed by a confluence of resistance around the 200-day simple moving average – the latter of which should offer significant resistance. Together, the areas overhead will look to keep a lid on price while support beneath – namely at the 6,990 level - looks to keep price afloat if risk aversion returns. Subsequent support should reside at the recent low and a break below would likely open the door for further losses. In the meantime, follow @PeterHanksFX on Twitter for updates and insights.
DAX 30 TECHNICAL FORECAST
Outlook: Neutral
Moving across the pond, we can see the DAX 30 negotiating with resistance of its own. Originating in 2009, the ascending trendline narrowly overhead will look keep the DAX in check. Should price break above, secondary resistance may exist around 11,100 where the index gapped lower. If bulls can surmount the trendline, further gains could be established quickly as traders look to fill the gap.
DAX 30 WEEKLY PRICE CHART (2009 - 2020)
(Click on image to enlarge)
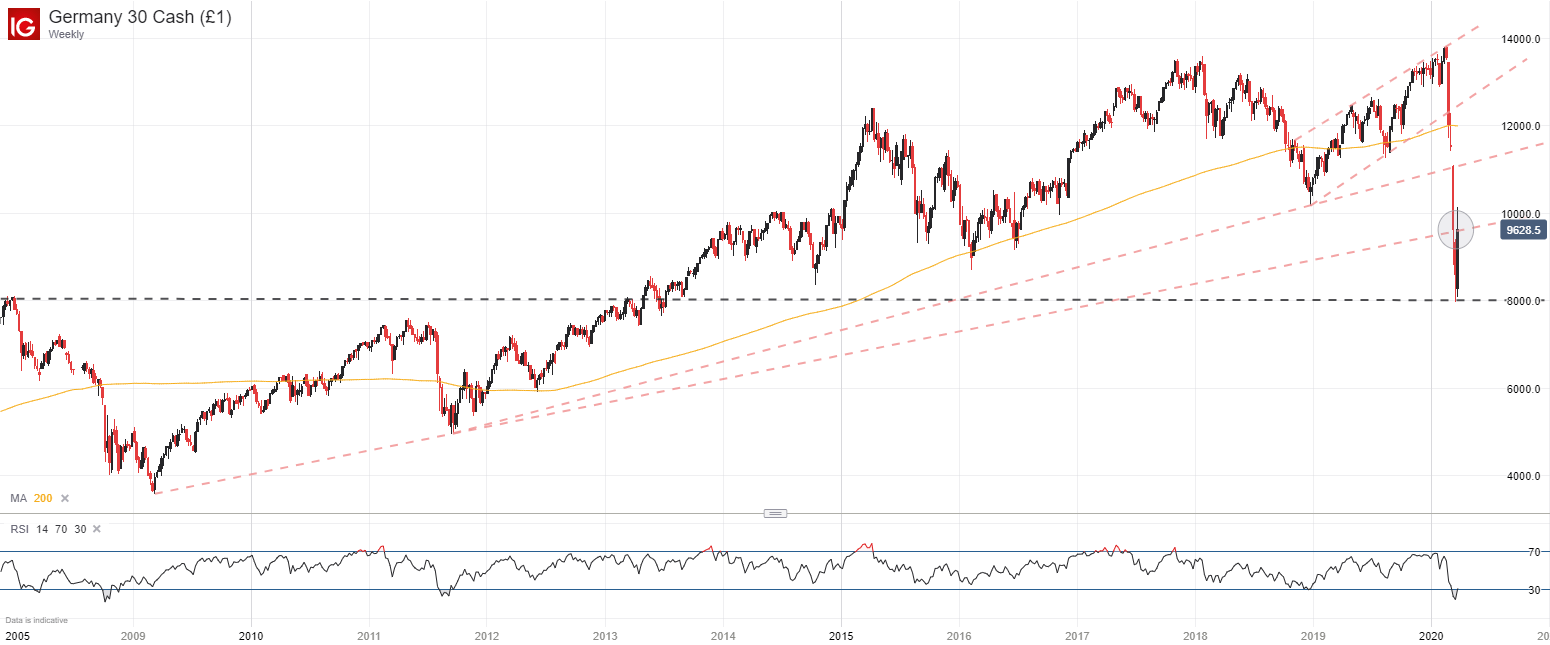
That being said, there is little to suggest the DAX will continue higher indefinitely. With uncertainty abound, bearishness may return with a vengeance and if it does, support around 8,000 should act as an area of support as it marked the low of the recent pullback. Trading beyond the level could suggest the index is vulnerable to further selling.
NIKKEI 225 TECHNICAL FORECAST
Outlook: Neutral
In the case of the Nikkei 225, an early barrier to a continuation higher may reside around the Fibonacci level at 20,365 which has given rise to price indecision in the past. While the zone is unlikely to make or break a stock rally on its own, its influence over price should not be ignored as it may present an attractive opportunity to reduce or increase exposure – depending on your directional bias.
NIKKEI 225 PRICE CHART: DAILY TIME FRAME (JANUARY 2016 – MARCH 2020)
(Click on image to enlarge)
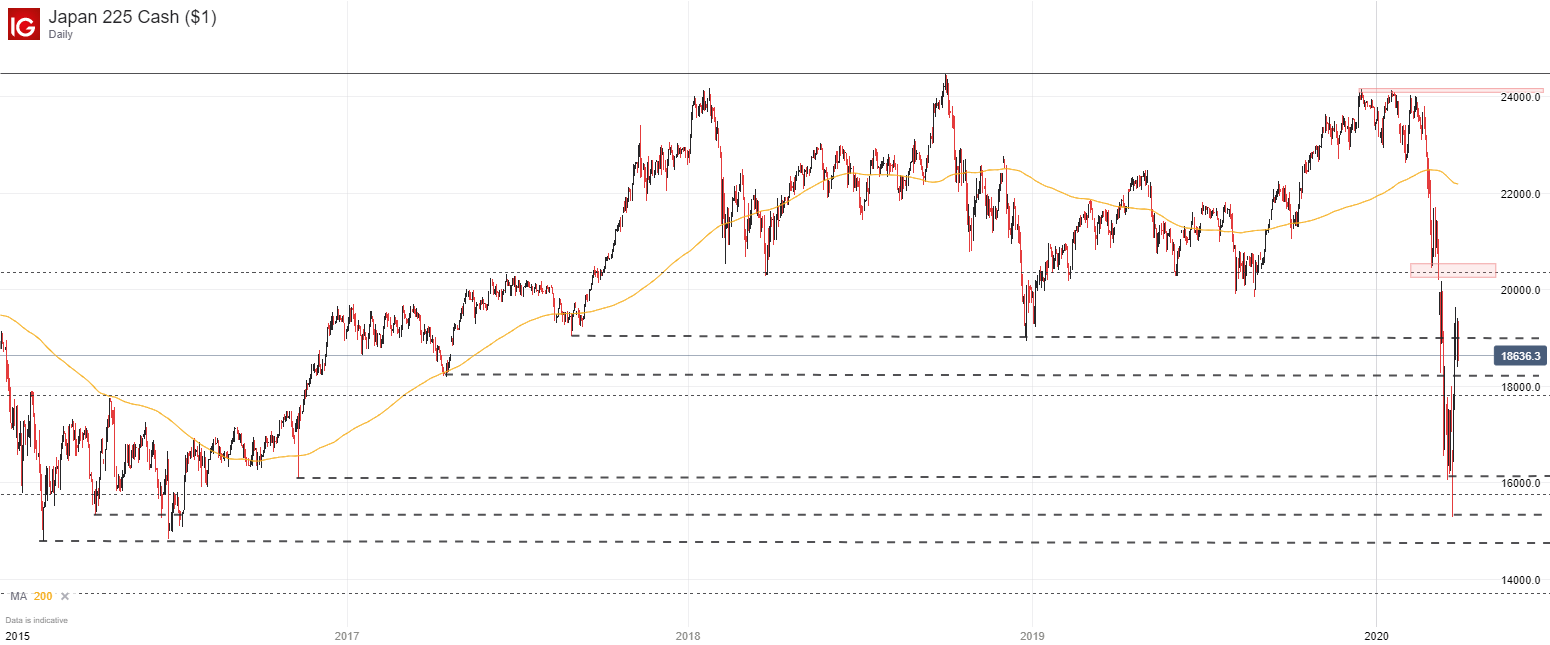
If bulls can retake the level confidently, subsequent resistance may come into play around the 200-day simple moving average but risks to the rally loom large as volatility rests at historic levels.


