
Nasdaq 100 At All-Time Highs: Time To Sell Stocks Or More Gains Ahead?
The Nasdaq 100 index made new historical highs this week, and this is generating some concerns among investors regarding the possible implications for market performance going forward.
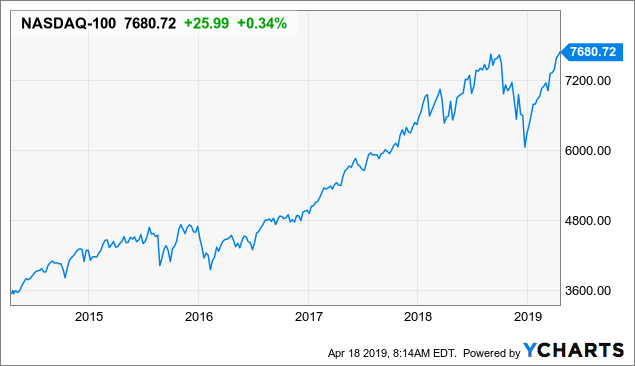
Data by YCharts
This is understandable from an emotional and intuitive point of view. You always want to buy low and sell high, if prices are at all-time highs, it looks like it is a good time to be selling as opposed to buying stocks.
However, hard evidence indicates that all-time highs are no reason to sell stocks. On the contrary, strength begets strength in the stock market. New historical highs bode well for the indexes over the middle term, and stocks that are performing well tend to continue doing so more often than not.
Strength Begets More Strength
The data from Bull Markets takes a look at the returns produced by the Nasdaq 100 index when it reaches all-time highs for the first time in six months. Returns have been positive in the next year in all of those occasions since 1985.
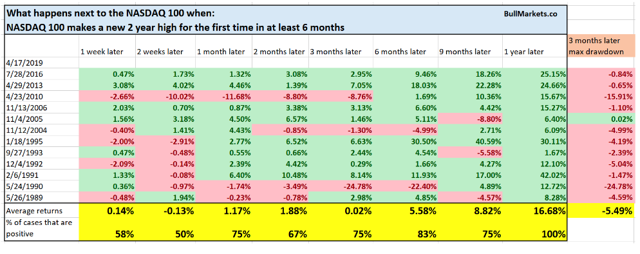
Source: Bull Markets
It is not just about the Nasdaq 100 as a particular index. When the Nasdaq 100 makes all-time highs, this tends to have a positive impact on the S&P 500 too.
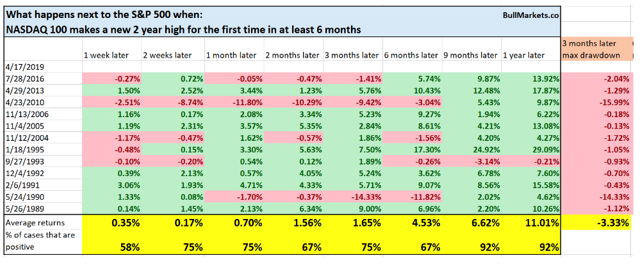
Source: Bull Markets
These kinds of statistics do not predict the future, of course. But the markets are made by humans and by algorithms that are designed by humans. To the extent that human behavior does not change much over time, it is reasonable to say that strength begets more strength in the stock market.
Many investors seem to believe that the market is more prone to crashing down after making all-time highs. However, that's not what usually happens.
When stocks are making new highs, chances are that prices will continue doing well in the middle term. The big market crashes usually come after markets have been weak for quite some time and trading well below their historical highs.
The chart below shows how the Nasdaq 100 performed near the top of the tech bubble in 2000-2001. As we can see, a market top is kind of a process as opposed to a specific price level, and markets generally provide plenty of signals before a bull market turns into a bear market.
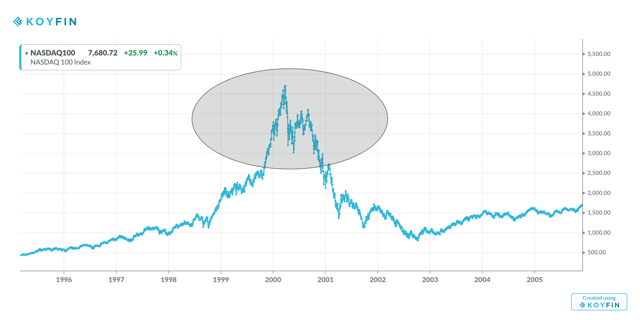
Source: Koyfin
Once again, during the credit bubble in 2008 the Nasdaq 100 went through a major topping process as opposed to falling from a cliff after making new highs for the year.
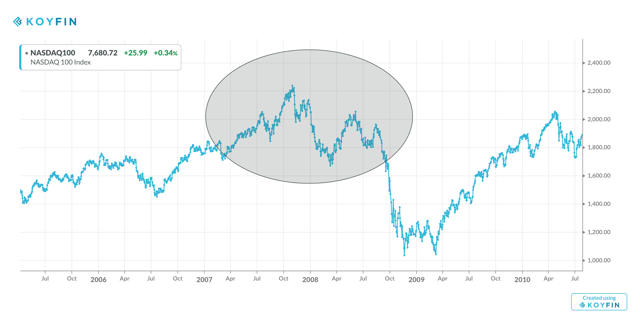
Source: Koyfin
A Smart Way To Protect Your Portfolio
Instead of selling when the market is making new highs, implementing trend-following strategies can be a more effective approach to risk control, which is supported by historical evidence.
Many trend-following detractors believe that the strategy is about buying high and selling low, but that is a misconception. In truth, trend-following is about buying when the price starts rising and selling when the price starts falling. The following chart explains this key distinction in brilliantly simple terms.
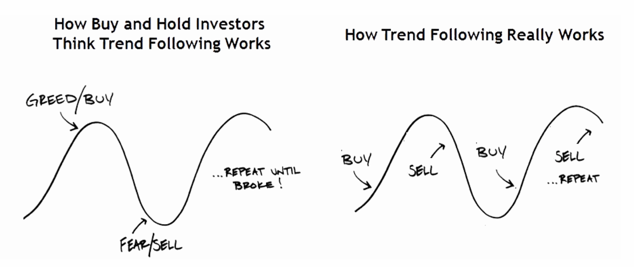
Source: Behaviorgap
The chart shows the evolution of Invesco QQQ (QQQ), an ETF that tracks the Nasdaq 100 index, and the 200-day moving average as a trend following indicator. The indicator is far from perfect or infallible, but it does a solid job at signaling the big uptrends and downtrends in the ETF over the long term.
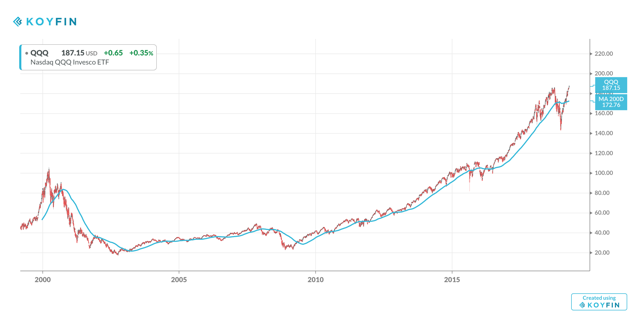
Source: Koyfin
The following backtest is based on a simple and straightforward idea: Picking the strongest stocks in the Nasdaq 100 index based on momentum and protecting the portfolio when the index as a whole is in a downtrend.
We begin by running the Stocks on Fire algorithm on companies in the Nasdaq 100 index. This algorithm is a stock picking tool based on two main return drivers: price momentum and fundamental momentum.
In simple terms, the Stocks on Fire algorithm looks for companies that are delivering better than expected sales and earnings numbers and stocks that are outperforming the market. The main concept behind the algorithm is that winners tend to keep on winning, both at the fundamental level and at the price performance level.
The algorithm has delivered market-beating returns over the long term. The chart below shows backtested performance numbers for companies in 5 different Stocks on Fire buckets over the years.
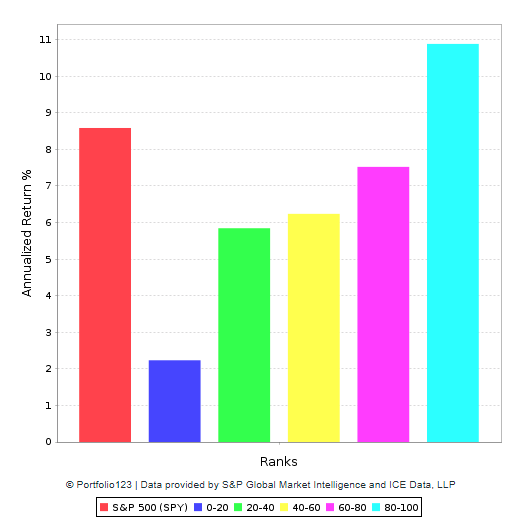
Data from S&P Global via Portfolio123
The quantitative strategy picks the 20 stocks with the highest Stocks on Fire ranking in the Nasdaq 100 and it rebalances monthly. Trading expenses are assumed to be 0.2% per transaction, and the benchmark is Invesco QQQ ETF.
In addition to this, the portfolio is protected by taking a short position in the Invesco QQQ ETF when the market-tracking ETF has a negative slope in the 200-day moving average over the past 10 days.
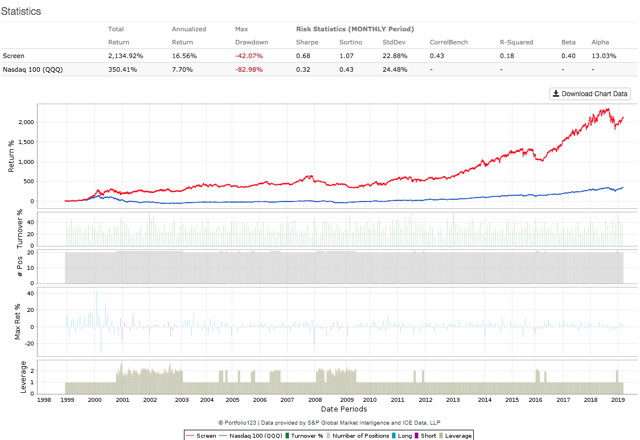
Data from S&P Global via Portfolio123
Since January of 1999 the strategy has clearly outperformed the benchmark in terms of return, risk, and risk-adjusted return. To put the numbers in perspective, a $1000,000 investment in the quantitative strategy in January of 1999 would currently be worth $2.2 million, and the same amount of money invested in Invesco QQQ would currently be worth $450,000.
The table below shows more details regarding returns and risk for the strategy versus the benchmark over different periods.
| Return | Strategy | QQQ |
| Annualized | 16.56% | 7.70% |
| One Month | 4.73% | 4.11% |
| One Year | 2.65% | 13.65% |
| Three Year | 93.03% | 73.86% |
| Five Year | 121.60% | 128.07% |
| Total | 2134.92% | 350.41% |
| Risk | Strategy | QQQ |
| Sharpe Ratio | 0.68 | 0.32 |
| Sortino Ratio | 1.07 | 0.43 |
| Max Drawdown | -42.07% | -82.98% |
| Standard Deviation | 22.88% | 24.48% |
It's important to note that the strategy underperformed the benchmark in the past year. This is mostly because the portfolio was hedged during the market correction in December of 2018. As markets rebounded rapidly in January of 2019, the strategy left some money on the table.
This is an unavoidable weakness in trend-following strategies, in periods when there is a rapid change in market direction, trend-following strategies will most probably underperform versus buy and hold. This is the price that we have to pay in exchange for implementing a strategy that can protect the portfolio during deep and ugly bear markets.
The table below shows the 20 stocks currently included in the portfolio. Since the Nasdaq 100 is in a clear uptrend, the portfolio remains unhedged as of the time of this writing.
| Ticker | Name |
Return 12 Months% |
| CSCO | Cisco Systems Inc | 26.17 |
| CMCSA | Comcast Corp | 27.95 |
| AVGO | Broadcom Inc | 28.42 |
| QCOM | QUALCOMM Inc. | 43.18 |
| SBUX | Starbucks Corp | 26.25 |
| INTU | Intuit Inc. | 41.44 |
| WDAY | Workday Inc | 44.06 |
| ADI | Analog Devices Inc. | 20.97 |
| XLNX | Xilinx Inc. | 99.71 |
| ORLY | O'Reilly Automotive Inc | 78.3 |
| PCAR | PACCAR Inc | 0.34 |
| CTRP | Ctrip.com International Ltd | 1.41 |
| MELI | MercadoLibre Inc | 44.42 |
| LULU | Lululemon Athletica inc | 80.24 |
| ULTA | Ulta Beauty Inc | 52.05 |
| FAST | Fastenal Co | 38.38 |
| KLAC | KLA-Tencor Corp | 14.3 |
| CDNS | Cadence Design Systems Inc | 67.59 |
| SNPS | Synopsys Inc | 35.42 |
| SYMC | Symantec Corp | -12.33 |
The Bottom Line
Every market environment is different to some degree, and there is no guarantee that the past will be a valid guide for the future. Nevertheless, making investment decisions based on solid statistical evidence is a far sounder approach than relying on opinions and speculation.
It doesn't make much sense to invest in a particular stock only because it is performing well, but it is even more irrational to stay away from a solid company only because the stock is rising sharply.
If anything, the statistical evidence shows that winners keep on winning in the market, and momentum is a powerful return driver, both when it comes to the market in general and individual stocks in particular.
Statistical research has proven that stocks and ETFs showing certain quantitative attributes tend to outperform the market over the long term. A subscription to The Data Driven Investor provides you access to profitable screeners and live portfolios based on these effective and time-proven return drivers. Forget about opinions and speculation, investing decisions based on cold hard quantitative data can provide you superior returns with lower risk.
Disclosure: I am long MELI, WDAY.
Disclaimer: I wrote this article myself, and it expresses my own opinions. I am not receiving compensation for it. I have no business relationship with ...
more


having a deja vu here..guess because you sent this piece to my email via Seeking Alpha..lol good article.
I don't read Seeking Alpha any more - too much fake news. At least according to the SEC:
talkmarkets.com/.../sec-targets-seeking-alpha-benzinga-in-crack-down-on-fake-news-pump-and-dumps