
My Top 10 Buy & Hold Forever Stocks
Back in the days of the wild west, people would secure their values by putting them into a coffee can.
That coffee can would go up on a shelf or under a bed… And stay there.
While this isn’t a practical idea today, the idea of buying and holding investments for the long-run is as practical (and effective) today as it was 200 years ago.
The 10 stocks examined in this article are all companies I’d be happy to add to my ‘coffee can portfolio’; to buy and hold forever.
With that said, many of these 10 are not buys today. But they should still be on investor’s radars. If they are not a buy today, this article shows when to buy.
Buy & Hold Forever Stock #1: Johnson & Johnson
Johnson & Johnson (JNJ ) is perhaps the single safest stock available on the market. It is one of only 2 companies with an AAA rating from Standard & Poor’s (Microsoft is the other).
Johnson & Johnson was founded in 1886. Today, the company has a market cap of $352 billion, making it the largest publicly traded healthcare corporation in the world.
The company has also paid rising dividends every year since 1972, for a streak of 46 consecutive years of dividend increases including 2018. More impressively, the company has a 30+ year streak of rising adjusted earnings-per-share every year. We have seen no other company come close to matching this streak of rising earnings every year. The stability of Johnson & Johnson is incredible.
The company’s success and stability come from its diversified business. Johnson & Johnson operates in 3 large segments. The company’s 3 segments are:
- Pharmaceuticals
- Medical Devices
- Consumer
The image below shows the company’s adjusted pre-tax earnings by segment in its most recent quarter.
(Click on image to enlarge)
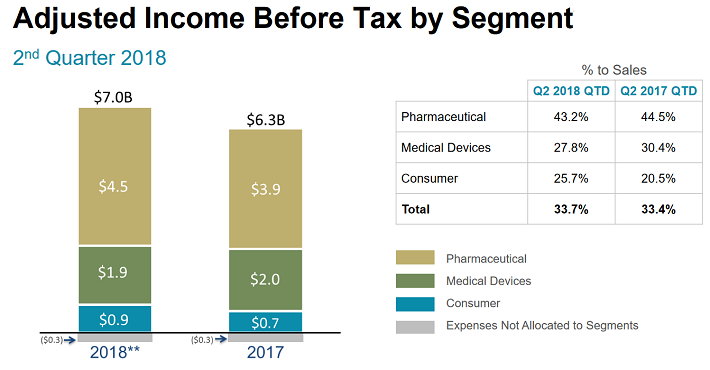
Source: J&J 2nd Quarter 2018 Presentation, slide 29
Johnson & Johnson’s consumer segment controls some of the most iconic names in over-the-counter healthcare. Among the company’s brands are: Listerine, Band-Aid, Tylenol, Zyrtec, Benadryl, Aveeno, and Motrin.
The company’s medical devices segment covers a wide range of equipment used for healthcare. The long-term growth driver in this segment is advancing technology, which drives new (and more expensive) healthcare equipment. Orthopedics are the largest contributor to this segment.
The Pharmaceutical segment’s best-performing drugs based on revenue (in millions) over the first 6 months of fiscal 2018 are below:
- Remicade: $2,709
- Stelara: $2,402
- Zytiga: $1,754
- Invega Sustenna: $1,416
- Xarelto: $1,257
- Imbruvica: $1,207
When to Buy Johnson & Johnson
Johnson & Johnson is the epitome of a high-quality business, but it isn’t a buy at any price…
Over the last decade, Johnson & Johnson shares have traded at an average price-to-earnings ratio of 15.8. The stock currently trades for a price-to-earnings ratio of 16.1 based on its expected 2018 adjusted earnings-per-share of $8.12.
Johnson & Johnson is near buy levels for long-term investors. We’d prefer waiting to buy when the stock is trading at or below its historical price-to-earnings ratio, but it is a potential buy at current prices.
Buy & Hold Forever Stock #2: Abbott Laboratories
Abbott (ABT) is a Dividend Aristocrat thanks to its 46 years of consecutive dividend increases. While not as large as Johnson & Johnson, Abbott is still one of the larger healthcare players based on its $112 billion market cap. The company was founded in 1888 and has grown to generate sales of nearly $30 billion a year.
Abbott operates in 4 segments:
- Nutrition
- Diagnostics
- Established Pharmaceuticals
- Medical Devices
The image below gives a good general overview of the company’s strengths and operating segments.
(Click on image to enlarge)
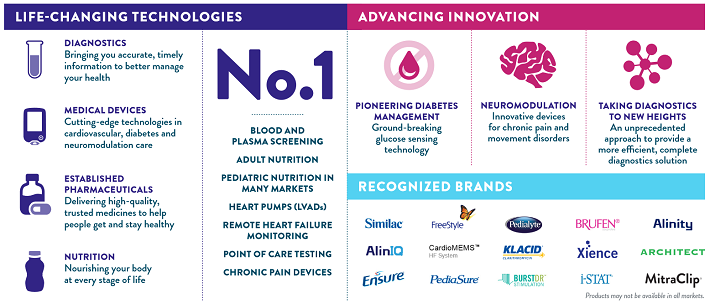
Source: Abbott Labs Infographic
It is important to note that all of Abbott’s established pharmaceuticals segment revenue comes from emerging markets, not developed markets. This gives the segment strong growth prospects.
The medical devices segment is the company’s largest, responsible for 37% of sales through the first half of fiscal 2018. The nutrition segment and diagnostics segment generated 24% and 25% of sales respectively over the same time period. The established pharmaceuticals segment is the company’s smallest based on revenue, generating 14% of total company revenue.
Abbott has managed to pay rising dividends for so long thanks to its diversified business model and strong competitive advantage.
The company’s size allows it to spend aggressively on research and development (and acquisitions), which fuels further growth. Research and development spending over the last 4 fiscal years is shown below:
- 2014 R&D expense of $1.3 billion
- 2015 R&D expense of $1.4 billion
- 2016 R&D expense of $1.4 billion
- 2017 R&D expense of $2.2 billion
When to Buy Abbott Laboratories
There’s no question Abbott Labs is a high-quality business likely to generate solid growth and rising dividend payments over the long run.
The company’s historical average price-to-earnings multiple is not as instructive as it was for Johnson & Johnson because Abbott Labs spun-off a large portion of its business in AbbVie (ABBV) in 2013. Based on Abbott Lab's high-quality business model, we believe a fair long-term price-to-earnings ratio for the company is around 19.
Abbott Labs is currently trading for a price-to-earnings ratio of 22.4 based on its expected 2018 earnings-per-share of $2.88.As a result, we believe the company is trading above fair value now. Investors should buy into Abbott Labs and hold for the long run when the stock is trading below a price-to-earnings ratio of 19.
Buy & Hold Forever Stock #3:3M
3M (MMM) is perhaps the single safest and strongest manufacturer on the market today. With a market cap of $121 billion, only Boeing (BA) is larger in the industrial sector.
3M has grown steadily over time since it was founded back in 1902. Additionally, the company has paid increasing dividends every year for 60 consecutive years and has paid uninterrupted dividends for more than 100 years.
The stability and success of 3M come from the company’s emphasis on innovation through research and development. In fiscal 2017, the company spent $2 billion (6% of total sales) on research and development. Innovation pays dividends at 3M; 30% of revenue from the company comes from products that didn’t exist 5 years ago.
In addition to its focus on innovation, 3M also has a highly diversified manufacturing profile. The company operates in 5 segments.

Source: 3M 2018 Q2 Presentation, slide 6
The percentage of total company operating profit generated by each segment through the first half of fiscal 2018 is below.
- Industrial: 29%
- Electronics & Energy: 24%
- Safety & Graphics: 19%
- Health Care: 18%
- Consumer: 10%
3M’s diversified business model has helped it to perform better during recessions than most industrial sector companies. During the Great Recession, 3M’s earnings-per-share declined from $5.60 in 2007 to a low of $4.52 in 2009 before recovering to new all-time highs in 2010. While the company saw a modest earnings-per-share decline during the severe Great Recession, the company still made over $1 billion in net profit in both 2008 and 2009.
When to Buy 3M
Unfortunately, 3M’s safety, growth, and quality come at a price.3M is currently trading for a price-to-earnings ratio of 19.4 using expected 2018 earnings-per-share of $10.33.
The company’s 10-year historical average price-to-earnings ratio is 17.2.3M looks somewhat overvalued at current prices relative to its historical average. We recommend investors wait until this high-quality manufacturer trades at or below its historical average price-to-earnings ratio before initiating or adding to a position in 3M.
Buy & Hold Forever Stock #4: McDonald’s
McDonald’s (MCD) has grown to be the undisputed king of the fast food industry since its creation in 1955. It’s hard to overstate how successfulMcDonald’s is compared to its peers. Comparing the company’s market cap to its peers give an idea of the scale of McDonald’s.
- McDonald’s has a market cap of $126 billion
- It’s next largest competitor [Yum Brands (YUM )] has a market cap of $27 billion
McDonald’s is nearly 5 times as large as its next largest competitor based on market cap. And, McDonald’s has the best dividend history in the restaurant industry by a wide margin.McDonald’s has paid rising dividends each and every year since initiating its dividend in 1976.
The company operates a highly recession resistant business model. It can be argued that McDonald’s actually performs better during recessions. That’s because people ‘substitute down’ during recessions. A family that might go to a mid-tier restaurant in good times will go to McDonald’s instead when money is tight. The company’s earnings-per-share history through the Great Recession is shown below:
- 2007 Earnings-per-share of $2.91
- 2008 Earnings-per-share of $3.67 (a 26% increase)
- 2009 Earnings-per-share of $3.98 (a 8% increase)
- 2010 Earnings-per-share of $4.60 (a 16% increase)
McDonald’s earnings-per-share grew by 58% from 2007 through 2010. Clearly, this is not a business that struggles when economic times are tough…But it also tends to grow during prosperous economic cycles as well.
McDonald’s sells a product that will likely never become obsolete. It thrives during recessions and performs well during all parts of the economic cycle. And, it is very shareholder friendly thanks to sizeable dividend payments and share repurchases.
When to Buy McDonald’s
As a business, McDonald’s is one of the safest to own for the long-run. As a stock, the valuation is concerning.McDonald’s is currently trading at a price-to-earnings ratio of 21.1 using expected 2018 earnings-per-share.
The company’s 10-year historical average price-to-earnings ratio is 18. Based on McDonald’s quality, we believe a price-to-earnings ratio closer to 20 is more appropriate for this recession-resistant, shareholder friendly stock. Still, the stock is trading above fair value at current prices. We recommend investors consider McDonald’s as a potential buy when trading at a price-to-earnings ratio of 20, and as a definite buy when trading at a price-to-earnings ratio of 18 or below.
Buy & Hold Forever Stock #5: Church & Dwight
Church & Dwight (CHD ) was founded in 1846 and has grown to reach a market cap of $13.7 billion. This makes the company smaller than some of the giants in the consumer products industry. A few of the company’s larger competitors are below:
- Procter & Gamble (PG) has a $207 billion market cap
- Unilever (UL) has a $168 billion market cap
- Colgate-Palmolive (CL) has a $58 billion market cap
While Church & Dwight is not the largest player in its industry, it is one of the most successful over the last decade. And, it controls many brands that are likely to exist far into the future and perform well regardless of the overall economy.
The company’s original power brand is Arm & Hammer. Church & Dwight has expanded from Arm & Hammer, and now controls other well known brands like: Trojan, Orajel, and OxiClean.The image below shows more of the company’s well-known brands.
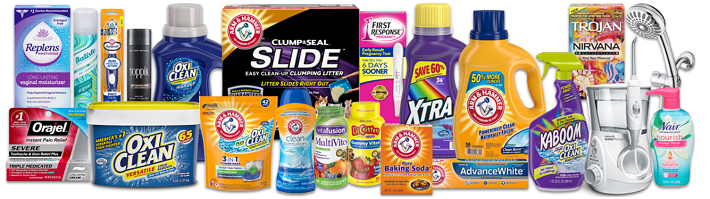
Source: Church & Dwight Investor Relations
Church & Dwight has leveraged its brands intelligently. The company has both expanded the reach of its own brands and used these cash flows to acquire other high-quality brands. From 2008 through 2017 Church & Dwight compounded its earnings-per-share at 11.6% annually. We expect continued earnings-per-share growth of approximately 9% per year.
When to Buy Church & Dwight
The one downside to Church & Dwight is the company’s valuation. The company’s historical average price-to-earnings ratio over the last decade is 21.5.
We expect Church & Dwight to generate earnings-per-share of $2.27 in 2018. Using expected 2018 earnings-per-share, Church & Dwight is currently trading for a price-to-earnings ratio of 24.6, which is in excess of its historical average valuation.
We recommend prospective investors wait for Church & Dwight to fall below its historical average price-to-earnings ratio of 21.5 before adding shares of this high-quality business.
Buy & Hold Forever Stock #6: Hormel
Hormel (HRL) was founded in 1891 and currently has a market cap of approximately $20 billion. The company is a Dividend King thanks to its impressive 52 consecutive years of dividend increases. Hormel has seen its earnings-per-share rise in 28 of the last 32 fiscal years, showing the continued strength of the company.
Hormel is a packaged food and meat company that operates in 4 segments:
- Grocery Products
- Refrigerated Foods
- Jennie-O Turkey
- International & Other
The image below shows many of the company’s more important brands.
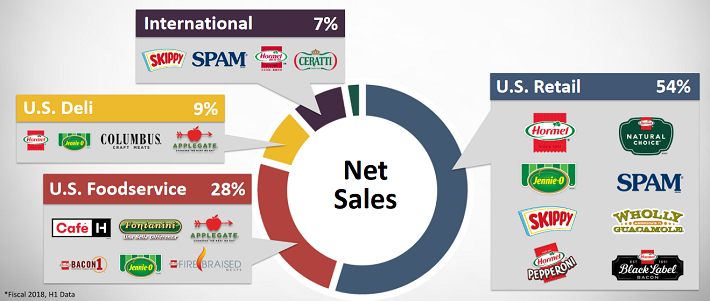
Source: Hormel dbAccess Presentation, slide 7
Through the first half of fiscal 2018, the percentage of operating profit by segment breaks down as follows:
- Grocery Products – 31% of operating profit
- Refrigerated Foods – 47% of operating profit
- Jennie-O Turkey – 15% of operating profit
- International & Other – 7% of operating profit
In the last 6 months, the grocery products and refrigerated foods segments have been by far the company’s most profitable. The Jennie-O Turkey segment is heavily dependent upon the commodity price of turkey because Hormel has its own Turkey farms. Turkey prices are currently down due to oversupply, resulting in lower profits for the segment.
Hormel’s packaged food and meat brand portfolio comprises the core of the company’s competitive advantage. Consumers will gladly pay a bit more to eat a trusted brand’s products. Moreover, the packaged foods industry is recession resistant. People buy groceries regardless of the overall economy.
When to Buy Hormel
Hormel stock has traded for an average price-to-earnings ratio of 18.4 over the last decade. We estimate its 10-year historical price-to-earnings ratio is around fair value.
Hormel is expected to generate earnings-per-share of $1.85 in fiscal 2018. This equates to a price-to-earnings ratio of 20 at current prices using expected 2018 earnings-per-share. Hormel appears to be a bit overvalued today. We recommend investors wait to initiate a long-term position and buy in when the stock is trading at or below its historical average price-to-earnings ratio of 18.4.
Buy & Hold Forever Stock #7: Costco
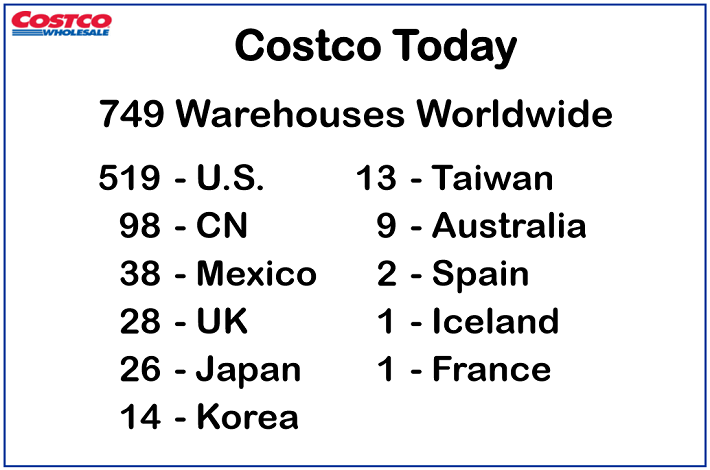
Costco (COST) was founded in Seattle in 1983. Since that time it has grown to generate $139 billion in annual revenue and now has a market cap of $99 billion. Costco has paid increasing dividends for 14 consecutive years; paying rising dividends each year since initiating its dividend in 2004.
Costco operates primarily in the United States but has locations throughout North America, Europe, and Asia.
Source: Costco Q3 2018 Presentation, slide 6
While Costco’s dividend history is impressive, it doesn’t compare to many of the older companies in this article. With that said, the company is still a Dividend Achiever (10+ years of rising dividends). What stands out about Costco is its phenomenal business model.
Costco has absolutely razor thin margins. It essentially operates its discount stores at nearly break even. The company makes money primarily through its annual memberships. Through the first 3 quarters of fiscal 2018, approximately 71% of the company’s operating income came from its memberships.
The company’s membership statistics are enviable:
- 90% Renewal Rate (an exceptionally high number)
- 50.9 million households
- 93.0 million total cardholders
Costco’s unique business model and focus on passing savings on to its customers is the foundation of its success. And the company has been successful; earnings-per-share grew by 8.1% a year from 2008 through 2017, a period which includes the Great Recession low of 2009. In 2009, Costco’s earnings-per-share fell by just 11%, showing the company’s resilience in a difficult economic environment.
When to Buy Costco
Costco has room to expand both in the United States and internationally. The company’s growth story remains. Over the past decade, Costco has traded at an average annual price-to-earnings ratio of 23.8.
Investors have taken note of the company’s strength and growth. Today, Costco is trading for a price-to-earnings ratio of 31.3 based on expected 2018 earnings-per-share of $7.10.Costco looks significantly overvalued today. We recommend investors buy into Costco on a serious dip, when/if the company trades at or below its historical average price-to-earnings ratio of 23.8.
Buy & Hold Forever Stock #8: Exxon Mobil
Exxon Mobil (XOM ) is the largest publicly traded oil and gas corporation in the world based on its $331 billion market cap. The company has increased its dividend each year since 1982 (the longest streak in the energy industry) and has paid steady or rising dividends since at least 1956. Exxon Mobil is the largest of the oil and gas supermajors.
Through a dizzying array of spin-offs, mergers, and acquisitions, Exxon Mobil can trace its history back to Rockefeller’s Standard Oil. As the largest publicly traded oil company in the world, Exxon Mobil is in many ways the successor of Standard Oil.
Exxon Mobil’s history of rising dividends is especially amazing when one considers the cyclicality of the oil industry. Exxon Mobil’s profits are dependent upon the price of oil. The company has diversified its business model between upstream, downstream, and chemical enough that it can sustain its dividend even during periods of low oil prices.
Exxon Mobil’s upstream segment is its largest by far when the price of oil is not extremely low. The upstream segment is engaged in finding and producing oil. The downstream segment is engaged in oil refining, while the chemical segment is engaged in chemical production. The image below shows the company’s earnings by segment in its most recent quarter.
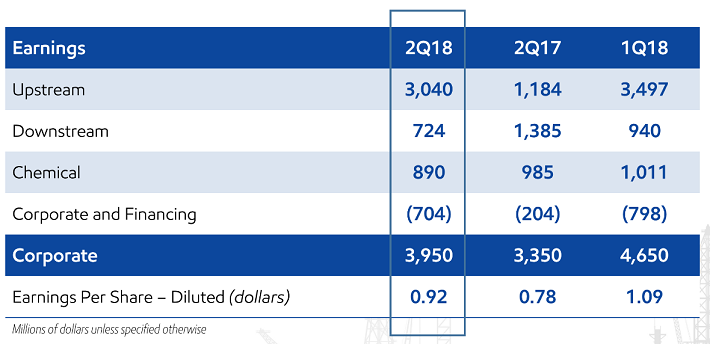
Source: Exxon Mobil 2nd Quarter 2018 Presentation, slide 4
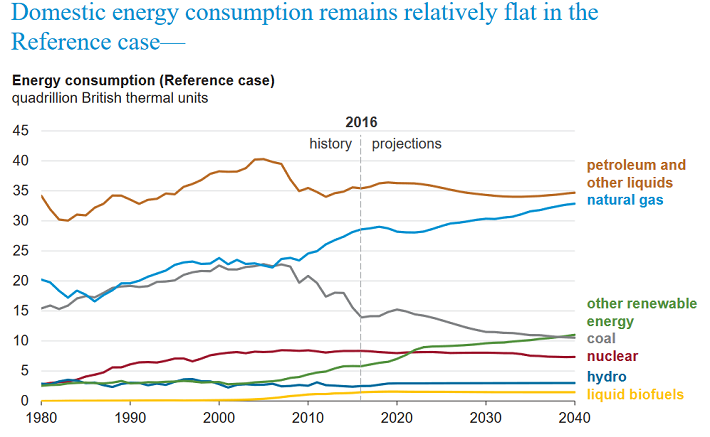
One concern long-term investors have with Exxon Mobil is the future of oil and gas versus renewables. While renewable energy is expected to grow, the world still runs on oil and gas and is likely to continue to do so. That’s because it’s far more efficient to harvest energy from oil than from the wind or the sun.
The image below shows the U.S. Energy Information Administration’s domestic energy consumption expectations through 2040.
(Click on image to enlarge)
Source: Annual Energy Outlook 2017, slide 9
Oil (and Exxon Mobil by extension) is likely to continue playing an important role in powering society for decades to come.
When to Buy Exxon Mobil
Exxon Mobil’s earnings-per-share are cyclical and depend on the price of oil. As a result, earnings-per-share don’t make the best gauge of the company’s valuation. Fortunately, Exxon Mobil’s dividend is very stable. The company’s average dividend yield from 2008 through 2017 2.8%.
Today, Exxon Mobil shares yield 4.3%. The company is priced to buy at today’s prices. A yield north of 3% appears to be a good entry point for Exxon Mobil shares. The company is a buy at current prices for investors looking for long-term exposure to the energy sector.
Buy & Hold Forever Stock #9: Brown-Forman
People have been drinking alcohol for a very long time – going back to 10,000 BC. The prohibition proved that alcohol is an essential part of American society. There are few, if any, industries with the staying power of the alcohol industry.
Brown-Forman (BF-B ) primarily sells hard liquor. Some of the company’s most popular brands are Jack Daniels, Finlandia, and El Jimador.
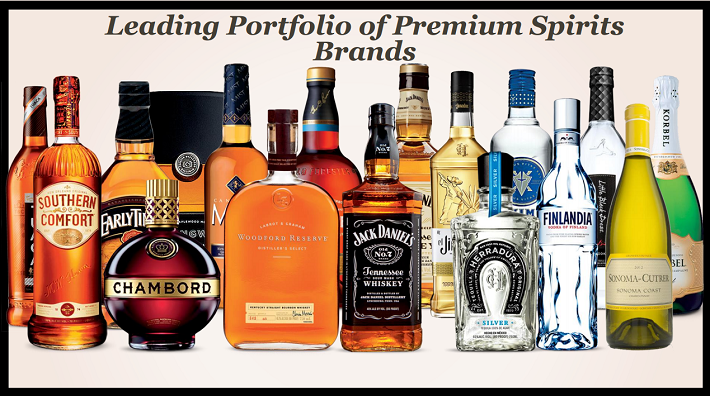
Source: Brown-Forman Back to School Presentation
Brown-Forman was founded in 1870 and headquartered in Louisville, Kentucky. Today, the company has a market cap of $26 billion and generates over $3 billion a year in sales. Additionally, Brown-Forman has increased its dividend payments for 34 consecutive years.
Brown-Forman has compounded its earnings-per-share at 8.2% a year from fiscal 2009 through fiscal 2018. This growth has come with very low risk; Brown-Forman performs well in all economic environments. Brown-Forman managed to grow its earnings-per-share each year through the Great Recession. More impressively, the company has generated steady or rising earnings-per-share each year since 2002.
Brown-Forman is likely to continue growing far into the future. The company has expanded internationally and should see continued growth in emerging markets. Brown-Forman can leverage its iconic brands (especially Jack Daniels) to continue growing. And since it sells a product that is likely to be popular for the long-run, there is little risk of obsolescence.
When to Buy Brown-Forman
While Brown-Forman is an excellent business, it often trades at a lofty valuation premium. The company’s historical average price-to-earnings ratio over the last decade is 24.6. The last year the company’s average price-to-earnings ratio for the year was below 20.0 was in 2010.
In some cases, investors must pay up for the rare combination of growth, safety, and shareholder-friendly management. We recommend considering buying into Brown-Forman when it trades below its historical average price-to-earnings ratio of 24.6.It is a strong buy when trading for a price-to-earnings ratio below 20.
Using expected fiscal 2019 earnings-per-share $1.80, Brown-Forman is trading for a price-to-earnings ratio of 29.7 today. The company appears significantly overvalued at current prices.
Buy & Hold Forever Stock #10: Kimberly-Clark
Kimberly-Clark sells disposable branded consumer products. Some of the company’s most well-known brands include Viva, Kleenex, Scott, Depend, Kotex, Cottonelle, and Huggies.
Amazingly, the company’s products are used by 25% of the world’s population. Kimberly-Clark’s products are sold in more than 175 countries. The company itself was founded in 1875 and has grown to reach a market cap of $41 billion with annual sales of over $18 billion.
Kimberly-Clark operates in 3 segments: Personal Care, Consumer Tissue, and K-C Professional. The image below gives an overview of each segment.
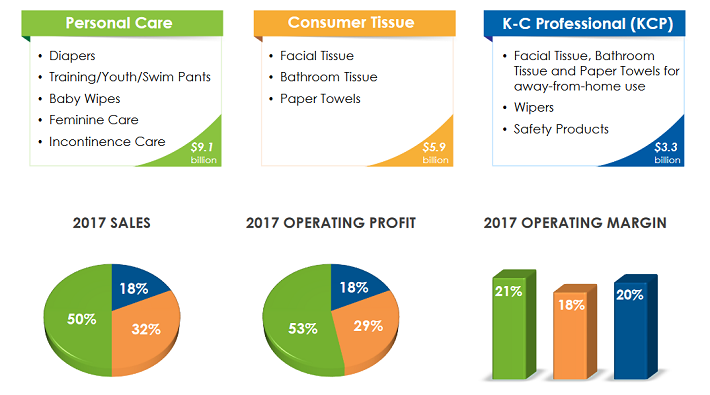
Source: Kimberly-Clark Investor Presentation, slide 6
Kimberly-Clark is a remarkably stable business. This is exemplified by its 46 years of consecutive dividend increases.
Kimberly-Clark is also meaningfully recession- resistant. The company saw only a modest earnings-per-share decline from 2007 to 2008 ($4.25 to $4.06), and then reached new earnings-per-share highs (for the time) of $4.52 in 2009, during the worst of the Great Recession.
From 2009 through 2017, Kimberly-Clark underwhelmed investors. The company managed to grow earnings-per-share at just 4.1% a year over this time. With that said, growth has picked up since 2015 and the company expects 7.5% adjusted earnings-per-share growth in fiscal 2018.
When to Buy Kimberly-Clark
Kimberly-Clark stock’s historical median price-to-earnings ratio over the last decade is around 18. We believe a price-to-earnings ratio of 18.0 is near fair value for Kimberly-Clark.
The company is expecting earnings-per-share of $6.70 in fiscal 2018. At current prices, this comes to a price-to-earnings ratio of 17.4. As a result, Kimberly-Clark appears to be a buy at current prices as it is trading slightly below its historical median price-to-earnings ratio.
Final Thoughts
When one invests in high-quality businesses at fair or better prices, there’s little else to do but wait for the businesses to compound your wealth over time.
All 10 of the companies in this article pay dividends and are very likely to pay rising dividends over time. This gives the added benefit of a growing income stream.
While not all of the 10 stocks in this article are buys today, they are deserving of a spot on every long-term investor's shopping list for when they trade at fair or better prices.
Disclaimer: Sure Dividend is published as an information service. It includes opinions as to buying, selling and holding various stocks and other securities. However, the publishers of Sure ...
more


Thanks for sharing