
Muted Reaction From Markets As US Q1 GDP Prints At 6.4%
MUTED REACTION FROM MARKETS AS US Q1 GDP PRINTS AT 6.4%
Q1 GDP for the United States came in at an impressive 6.4%, surpassing expectations for a 6.1% print. After the record-breaking contraction in Q2 2020, economic activity rebounded swiftly in Q3 before slowing in Q4 as a resurgence in virus cases dragged on the growth rate. In Q4 of 2020, GDP grew at an annualized 4.3%. Policy makers had already communicated their expectations of Q1 GDP in the range of 5% or 6%, and as a lagging indicator of economic activity, the print had a little initial impact on financial markets.

DAILYFX ECONOMIC CALENDAR – APRIL 29TH, 2021
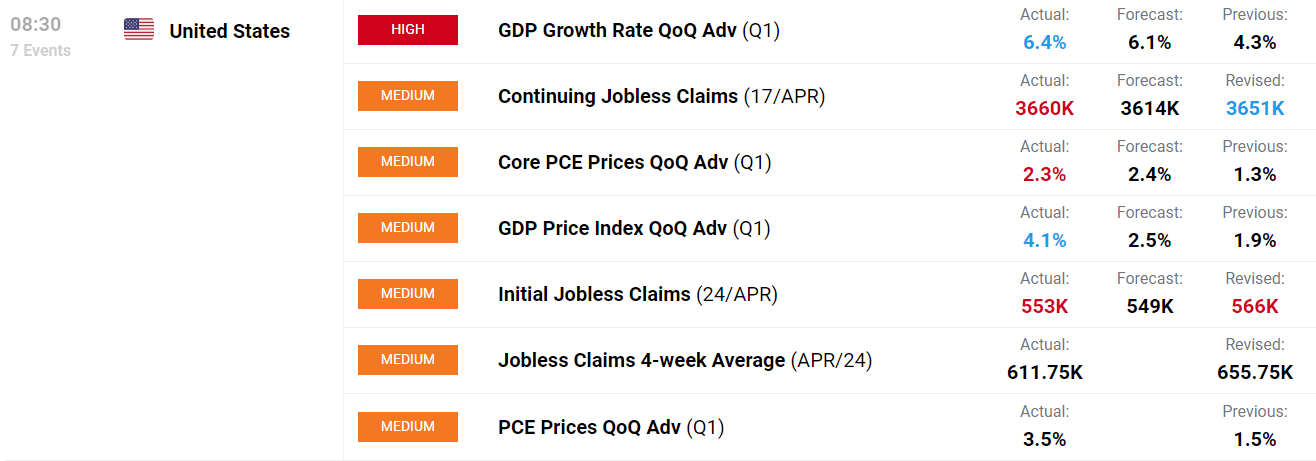
Source: DailyFX Economic Calendar
Other data released alongside GDP crossed the wires more-or-less in line with expectations. Jobless claims declined from the previous week, but printed slightly higher than hoped, at 553k vs. a forecast of 549k. On a Quarter-over-Quarter basis, PCE rose to 2.3% from 1.3% the previous period, but policymakers have said these increases in inflation are transitory and will not warrant a response.
Overall, economic data from the US continues to point towards a solid and steady recovery. Impressive vaccination numbers have reduced the chance of another dip lower in economic activity, with many expecting that the economy will be able to return to some level of normalcy over the summer.
From their pandemic peak in late March, US Treasury yields dropped lower in April. After hitting a one-month low around the 1.55% level, the 10yr yield mostly consolidated between 1.55% and 1.6% ahead of the April FOMC meeting. The US Dollar followed a similar path, with the DXY hitting a high of around 93.40 in late March before declining throughout April. In recent days, the DXY had traded around the 91.00 level. Following no changes to policy at April’s FOMC meeting, the DXY fell to trade around the 90.50 level, its lowest point since late February. Immediately ahead of the prints, the 10yr Treasury yield rose to a two-week high.
US DOLLAR / 10YR TREASURY YIELDS – 15 MINUTE TIME FRAME (APRIL 2021)

Chart created by Izaac Brook, Source: TradingView
Following the unsurprising prints, the 10yr Treasury yield pulled back from the two-week highs hit immediately prior. The DXY dropped from 90.65 to below 90.60. With the FOMC holding steady and these data prints already mostly priced in, further reactions from Treasury yields or the Dollar will likely be on hold until the Fed or some other macro catalyst comes into play.


