
Must Watch Charts For Monday, November 18
There are a lot of extremes showing up in the markets right now, so let’s take a look at some of the charts and see if we can make sense of it all.
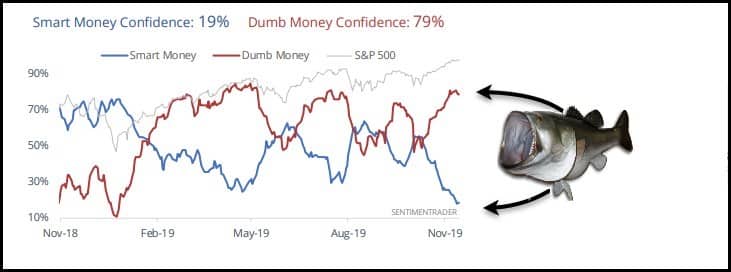
Firstly, this chart of smart money and dumb money care of Kimble Charting Solutions.
I won’t profess to know how this indicator is calculated, but we can see the last time the gap between Smart Money Confidence and Dumb Money Confidence was in May 2019 when SPX dropped from 2950 to 2730.
Smart Money Confidence is also at the lowest levels seen in the last 12 months.
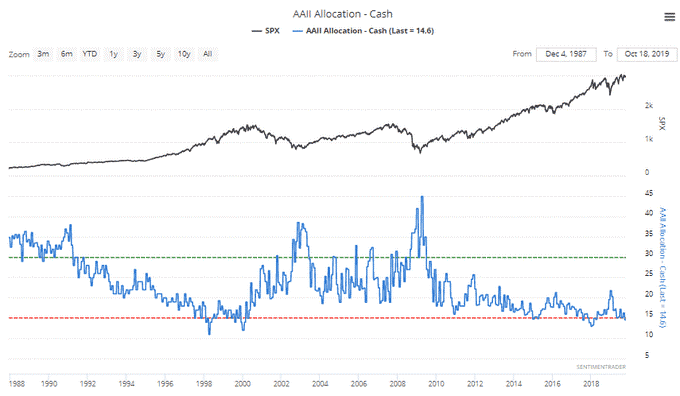
The next chart is courtesy of Lance Roberts and shows that the level of investor cash holdings is at an extremely low level. Is everyone fully invested at this point? Time will tell.
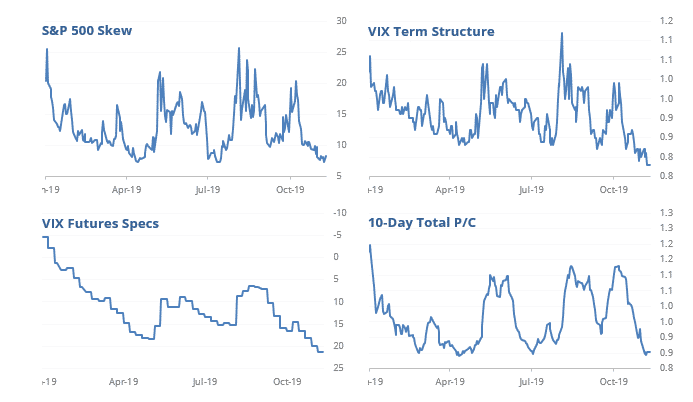
The following charts from SentimenTrader show further evidence of markets at extremes.
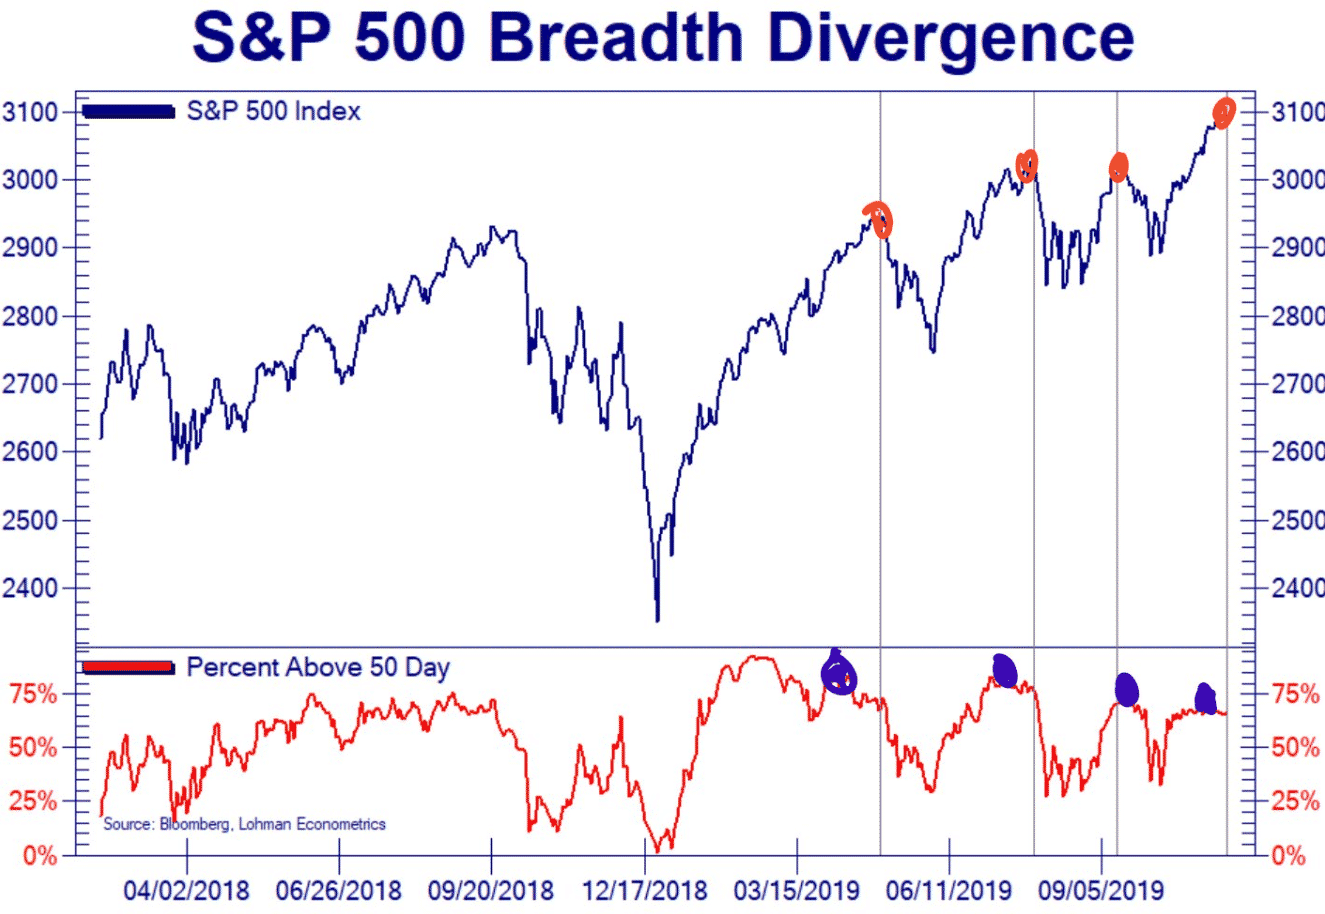
You guys know I love a good bearish divergence chart and this one from Not Jim Cramer fails to disappoint.
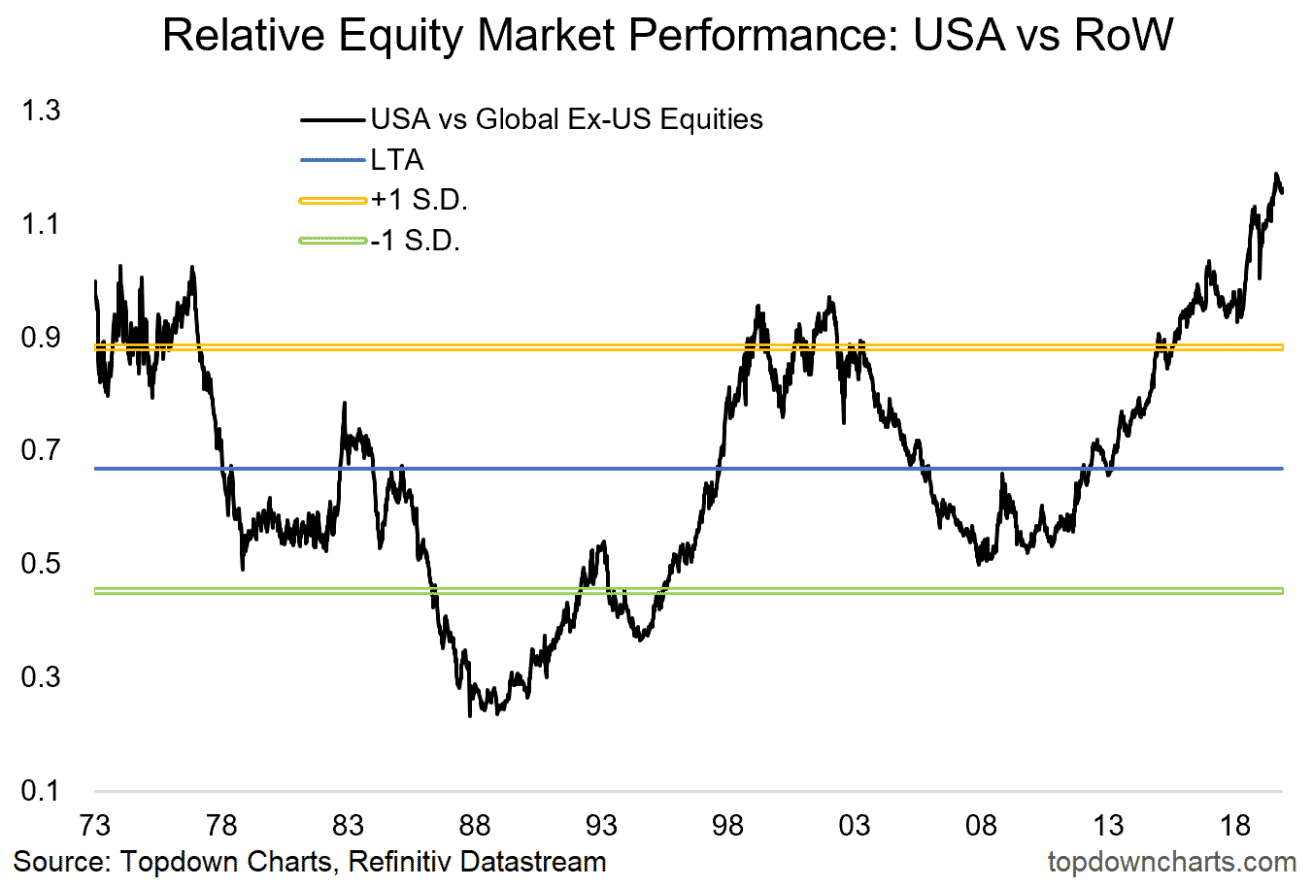
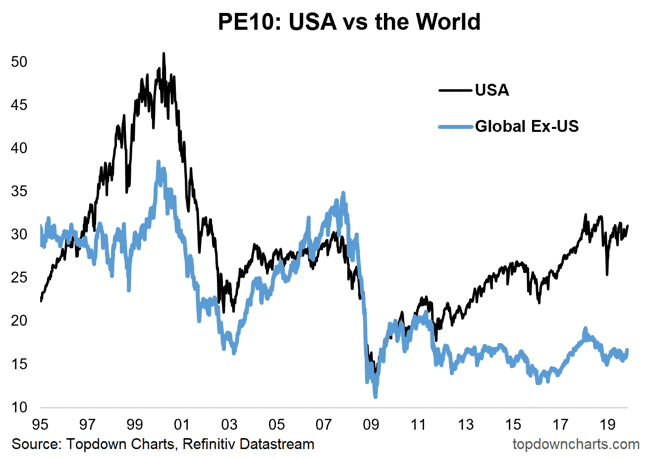
And finally, a couple from TopDowncharts showing that maybe the US is looking a bit expensive compared to the rest of the world.
So, let’s see what happens this week. The bulls are well and truly in control, but some warning signs are beginning to show. Things can change quickly so stay nimble and always manage risk.
Disclaimer: The information above is for educational purposes only and should not be treated as investment advice. The strategy presented would not be suitable for investors who are ...
more

