
Multiple Ways To Review Wage Growth
The stock market sold off on Friday after the monthly labor report came out, but the results didn’t justify the decline. Some parts of the report were disappointing, and others were encouraging. Investor sentiment was negative, so any news was viewed as bad news. Private sector job growth was 161,000 which missed estimates by 22,000. That’s better than the headline number which missed estimates by 35,000 partially because of 6,000 declines in government jobs.
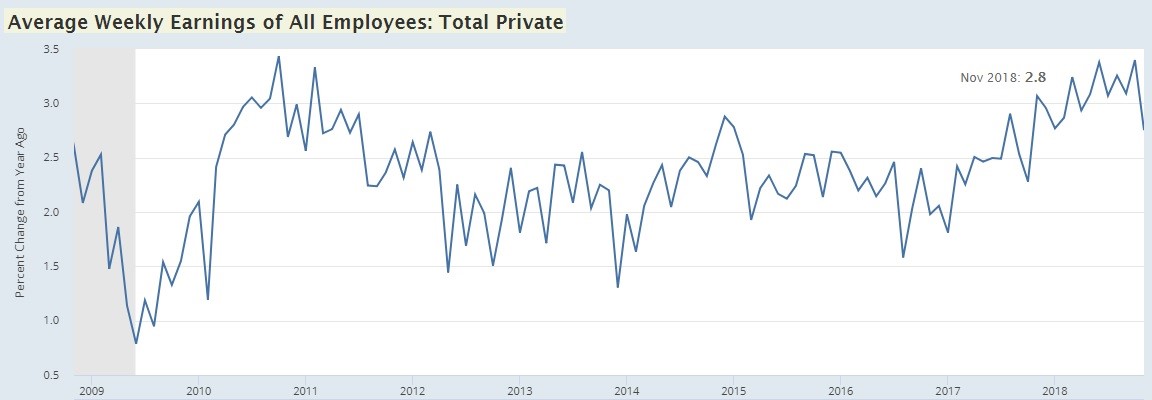
Wage growth was a mixed bag. On a month over month basis, average hourly wage growth was 0.2% which was up from 0.1% growth but missed estimates for 0.3% growth. On a year over year basis, growth was flat at 3.1% which missed estimates for 3.2% growth. On the positive side, this was the first back to back year over year growth of at least 3% since April 2009. On the negative side, hours worked missed last month’s report and the consensus of 34.5 hours, coming in at 34.4 hours. Weekly pay is all that matters. Working less and getting paid more per hour doesn’t drive retail spending. As you can see from the chart below, this scenario caused average weekly wage growth to fall from 3.4% to 2.8%.
(Click on image to enlarge)
Source: FRED
The 3.4% growth was the highest since October 2010. This recent decline puts growth at the lowest rate since October 2017. One big reason for this weakness is the tough comparison as growth in November 2017 increased from 2.3% to 3.1%. The 2-year stacked growth was 5.68% in October and 5.82% in November, meaning November was stronger. The trouble is other strong growth numbers will be lapped soon. It’s not ideal to have decelerating wage growth even if it’s because of strong comparisons.
This decline in weekly wage growth supports the notion that the Fed shouldn’t be hawkish. However, wage growth hasn’t driven up core inflation anyway. Wage growth at this point in the cycle is the most important for workers because most workers are employed. While inflation declines are always nice, real wage growth during recessions doesn’t help all the workers who have been laid off.
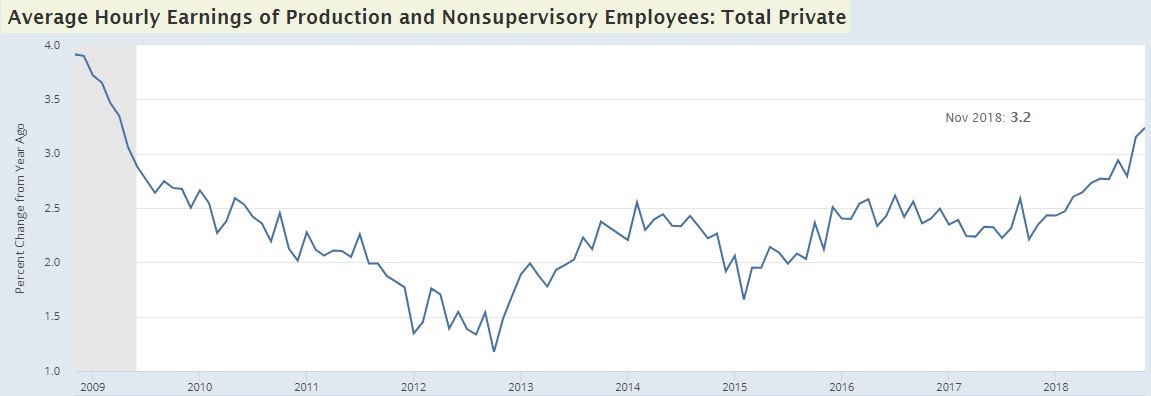
Now let’s review the positive sign for workers. As you can see from the chart below, wage growth for private production and non-supervisory workers increased to 3.2% which is the highest growth rate of this expansion.
(Click on image to enlarge)
Source: FRED
This is the best reading since April 2009 when the economy was in a recession. To be clear, this November report also lapped a tougher wage growth reading than October, but growth still accelerated. It just wasn’t as tough as the one the November weekly earnings report lapped.
In the past 3 cycles, production employees’ wage growth peaked at 4.4%, 4.4%, and 4.3%. Wage growth is still way below those peaks. Even though growth is improving, this metric also supports the case for pausing rate hikes.
Is The Labor Market Full?
The labor market isn’t currently full because 208,000 jobs have been created per month this year which is above the past 2 years and about double the additions needed to keep up with population growth. Investors aren’t backward looking which makes that data immaterial. They are trying to figure out if the labor market will become full next year. That could spike wage growth, which wouldn’t necessarily be bad unless it drove inflation higher. It might not, especially since commodity prices have been falling.
Your determination of the fullness of the labor market depends on which data you look at. That’s what makes it both interesting and difficult to analyze. As you can see from the chart below, the labor force participation ratio for women 25 to 34 years old is higher than the previous cycle’s peak and just below the 2000 peak.
(Click on image to enlarge)

Source: Renaissance Macro Research
The labor market for female workers might be at its peak, but that’s tough to determine because it could be in a secular uptrend as women delay having children to focus on their career.
If women are going to close the gap with men, they have over 13 percentage points to climb. Women are working more, which means we wouldn’t be surprised if this participation rate surpasses the 2000 peak. On the other hand, men’s participation rate from 25-34 is in a secular decline as it has fallen from about 95% in 1990 to about 89% now. The rate won’t hit the peak of about 93% from 2007, but it should increase further in 2019. In summary, it seems like the female labor market is full and the male’s isn’t, but the size of the secular movement makes it difficult to tell.
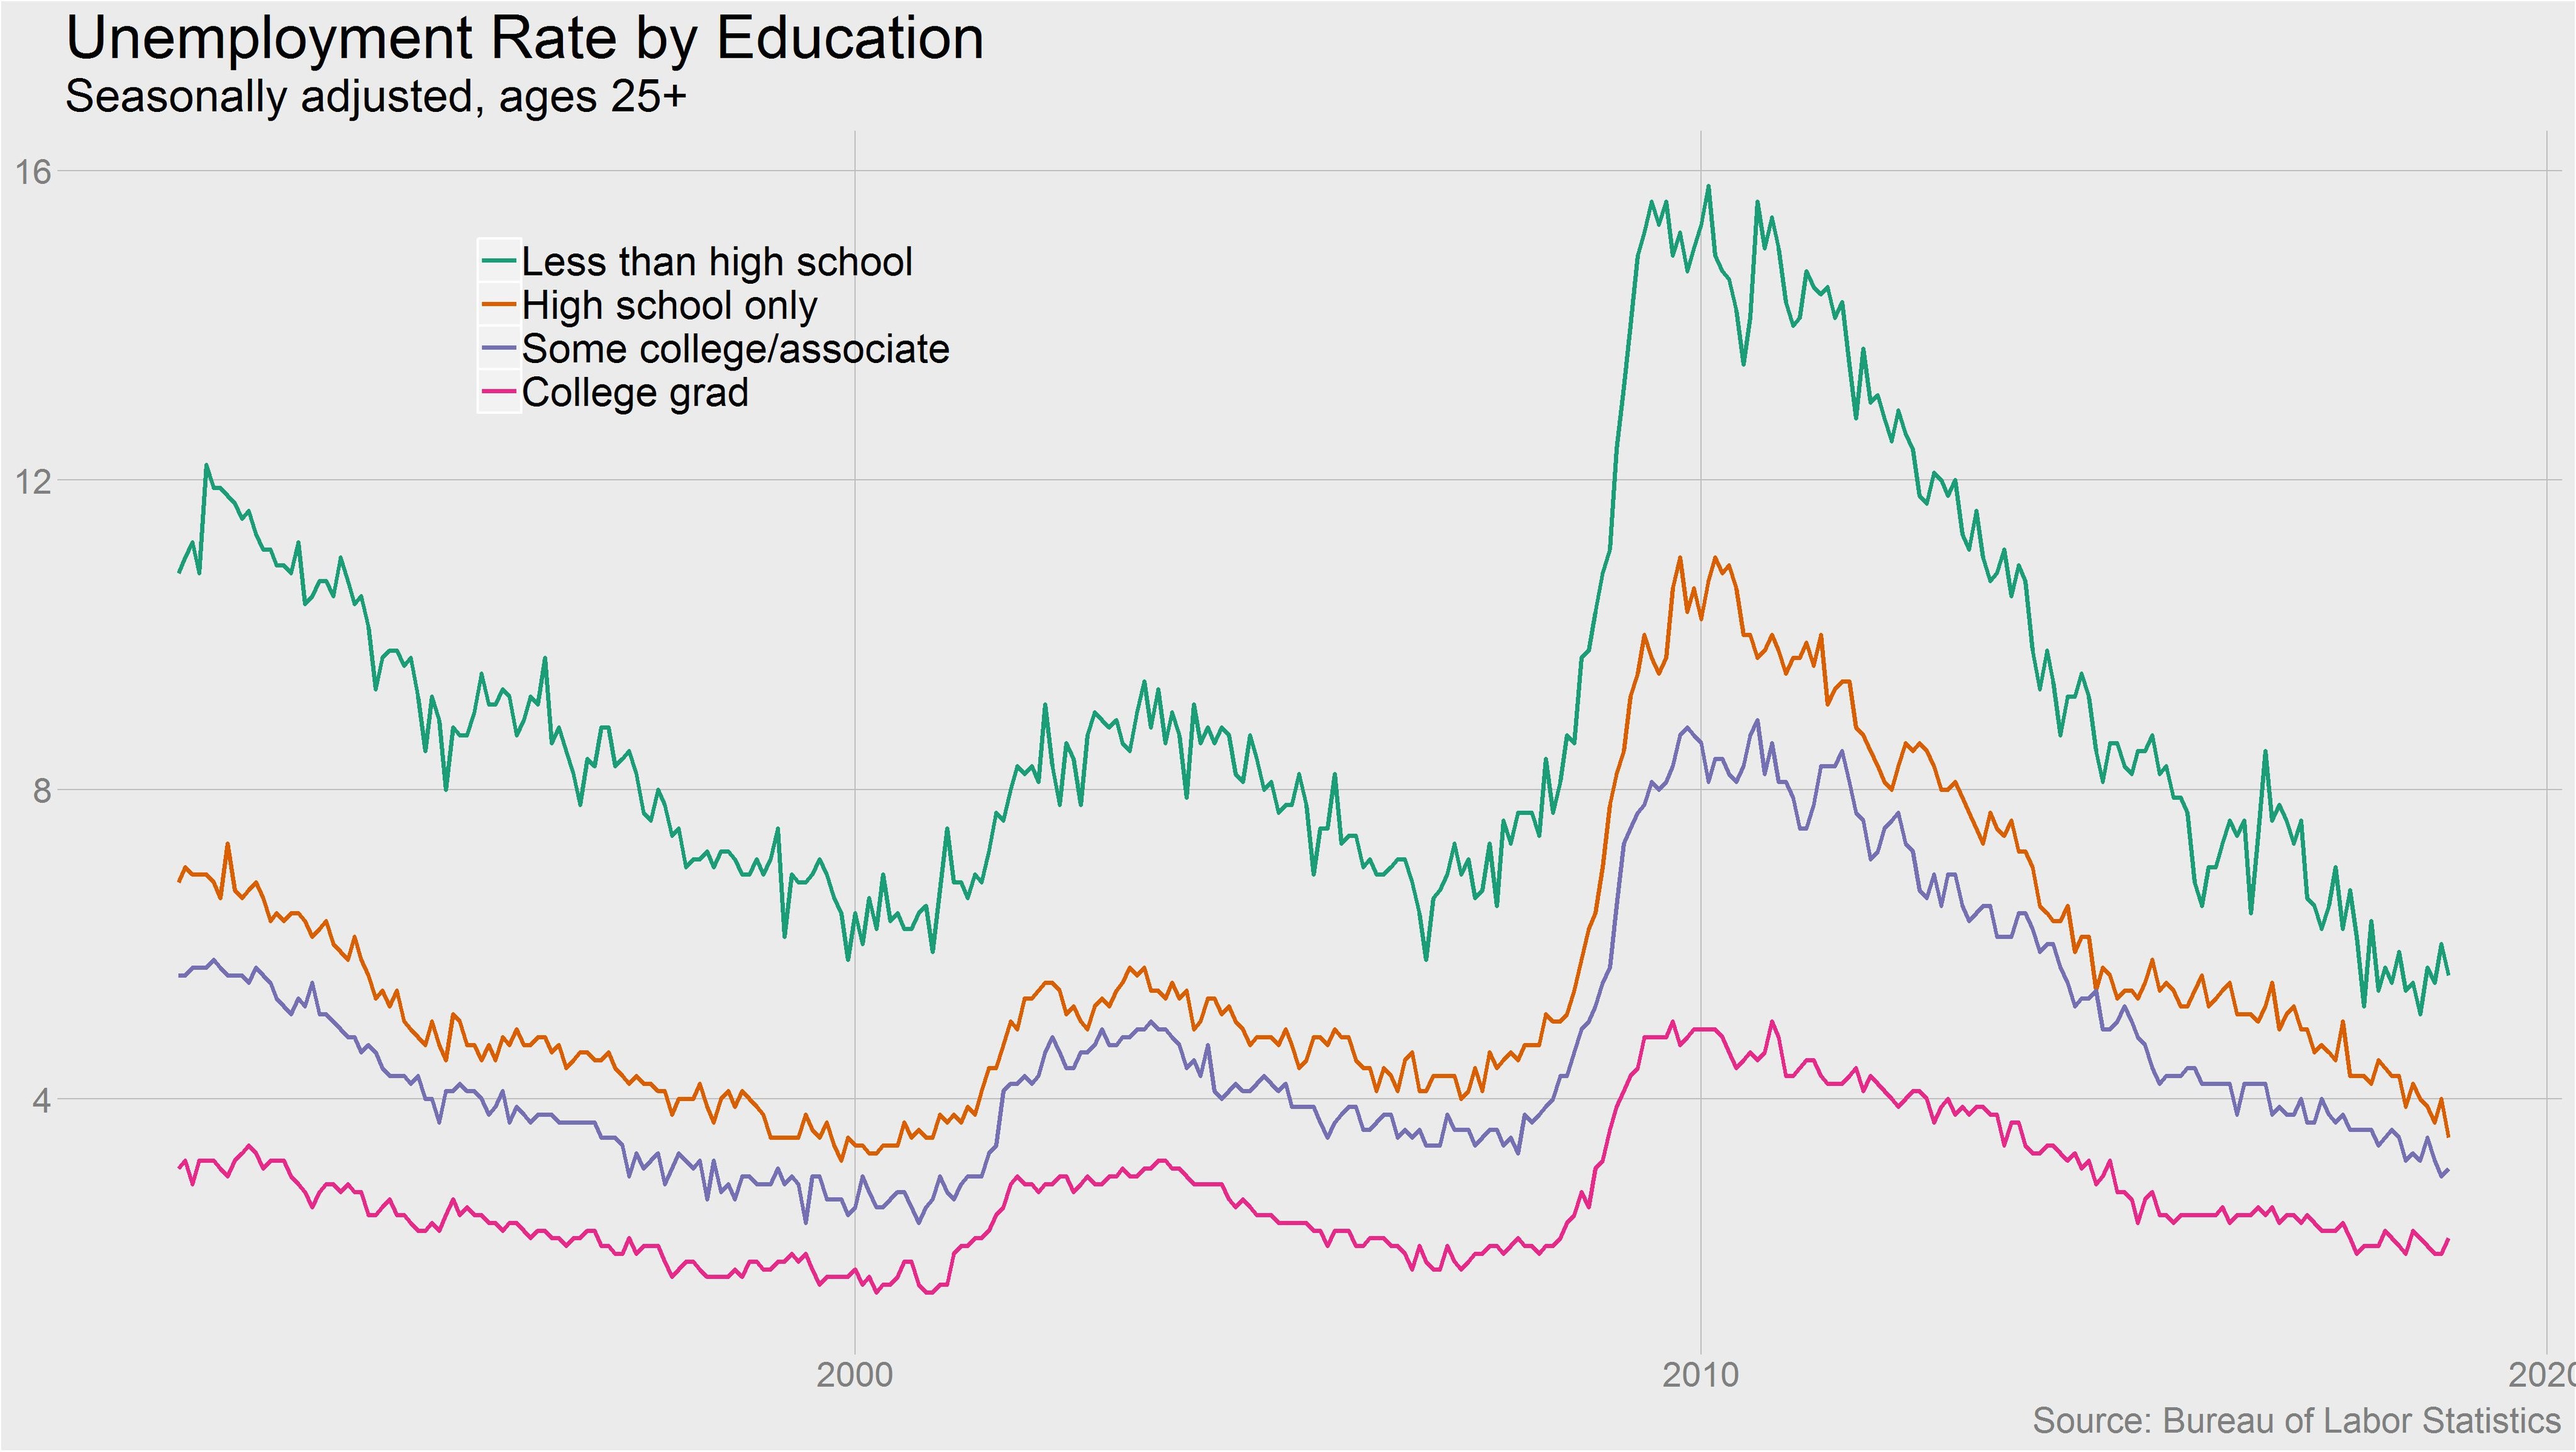
The chart below shows the unemployment rate by education.
(Click on image to enlarge)
Source: Ben Casselman
The less educated the group is, the wider the vacillations in the unemployment rate. Less educated people are more likely to lose their jobs during recessions because they are typically on the lower rungs of companies. The chart suggests the labor market is close to full because the unemployment rate for those with only a high school diploma is 3.5% which is the lowest rate since 2000. As we mentioned, wage growth is great when all these workers are employed. With declining slack, non-supervisory wage growth could reach the previous cycle’s high if the Fed doesn’t hike rates too much.
Are Stocks Cheap?
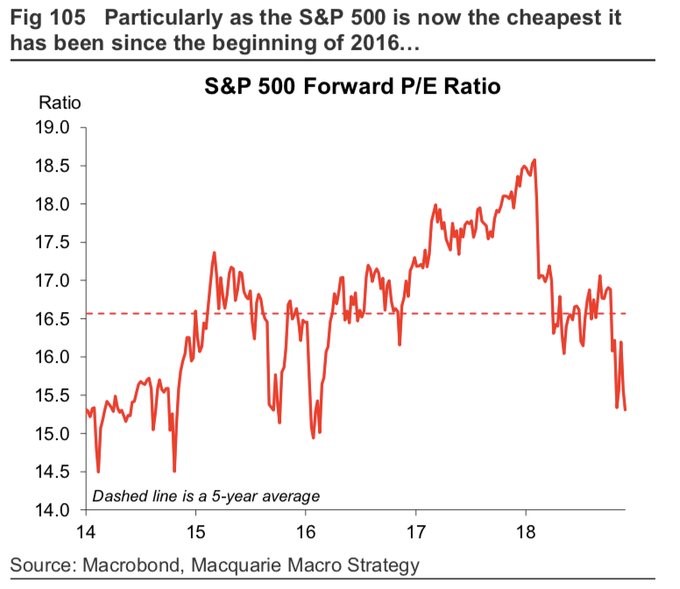
Being a stock market bear in September was reaching for low hanging fruit because earnings revisions were weakening and economic growth was starting to slow while stocks were at their all-time highs. Now the scenario is different as stocks have fallen 10%. As you can see from the chart below, the S&P 500’s forward PE multiple is the lowest since early 2016 which was a great buying opportunity.
(Click on image to enlarge)
Source: Macquarie Macro Strategy
It was easier to call for a slowdown in September 2018 than a recession in December 2018 because the slowdown had already started in September, while a recession hasn’t started yet.
To be clear, S&P 500 EPS growth of 5% to 7% next year translates to 2019 EPS of $168. Current estimates are for $173. However, the recent volatility suggests traders don’t believe those estimates. Therefore, selling stocks now implies the expectation of low single digit earnings growth at best.
Conclusion
Even if inflation falls in November, real weekly earnings growth won’t be great. However, real wage growth for production and non-supervisory workers will be strong. Workers with just a high school diploma have the lowest unemployment rate since 2000. With inflation falling, the Fed has the unique opportunity to slow rate hikes which will help workers. It would also help stocks which have the lowest forward PE ratio since early 2016. With no recession on the immediate horizon, a dovish Fed could help stocks avoid a bear market in 2019.
Disclaimer: Please familiarize yourself with our full disclaimer here.


