
Most Recent Commitment Of Traders: Peeking Into The Future Of Futures, Hodge Fund Positions Etc.
Following futures positions of non-commercials are as of August 20, 2019.
10-year note: Currently net short 401.8k, down 12.5k.
The German government Wednesday sold €824 million in zero-coupon 30-year bonds, at a negative yield of 0.11 percent. It offered €2 billion worth but there were no takers. The Bundesbank was forced to buy the rest.
Globally, some $17 trillion of bonds currently yield negative. Yield-hungry investors are desperate for safe assets. Why then the rather lukewarm reaction to the German auction? Time will tell if this represents a turning point – in all probability, it is not. It is possible it was too large. Or, investors are fearful of a repeat of 2015. Back then, leading up to the start of QE by the ECB, bonds rallied, only to sell off once the program got underway.
The eurozone economy is weakening, and the ECB is expected to cut rates when it meets next month as well as announce other stimulus measures. Globally, bonds have sold off for months. The 10-year Treasury yield peaked last October at 3.25 percent and closed Friday at 1.53 percent. Given how oversold they are, rates can rally anytime. But, longer-term, the probable path of least resistance is still down.
As global economic activity decelerates at best and contracts at worst, there will be bids underneath the long end of the curve. As things stand, the buyers are not playing these instruments for coupon payments. Who plans to hold them to maturity anyway? What they are losing in coupons will be offset by capital appreciation. At least that is the hope. So far, that is exactly how things have evolved. With negative interest rates in Europe and Japan, the upward pressure on sovereign US bonds is clear. Then again, negative rates for prolonged periods cannot be good and will not last. Nothing goes up forever. When that moment arrives, the disruption it will cause is probably too hard to model in. Until then, it is bulls’ (price) ball to lose.
30-year bond: Currently net short 65.1k, down 2.2k.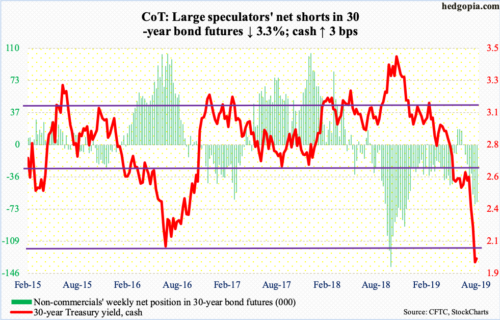
Major economic releases next week are as follows.
On Monday, durable goods orders (July) will be published. June orders for non-defense capital goods ex-aircraft – proxy for business capex plans – rose 1.5 percent year-over-year to a seasonally adjusted annual rate of $69.8 billion, within striking distance of record $70 billion set in July last year.
The S&P Case-Shiller home price index (June) is due out Tuesday. Nationally in May, US home prices appreciated 3.4 percent y/y, which is decent but much softer than the 6.5-percent pace recorded in March last year.
Thursday brings GDP (2Q19, second estimate) and corporate profits (2Q19, preliminary).
The advance estimate showed real GDP grew 2.1 percent in 2Q19, down from 3.1 percent in 1Q19. The Atlanta Fed’s GDPNow model says 3Q is on track for 2.2 percent growth.
In 1Q19, corporate profits with inventory valuation and capital consumption adjustments dropped 2.2 percent y/y to $2 trillion (SAAR) – first drop in five quarters. Profits peaked in 3Q14 at $2.2 trillion.
Personal income and spending (July) and the University of Michigan’s consumer sentiment index (August, final) are on tap Friday.
In the 12 months to June, core PCE, which is the Fed’s favorite measure of consumer inflation, rose 1.61 percent – ninth consecutive month of sub-two reading. The Fed has a two percent goal.
Preliminarily, consumer sentiment softened in August, down 6.3 points month-over-month to 92.1. As recently as May, the index read 100, which was the fourth reading of 100 or above since October 2017.
Crude oil: Currently net long 577.5k, up 37k.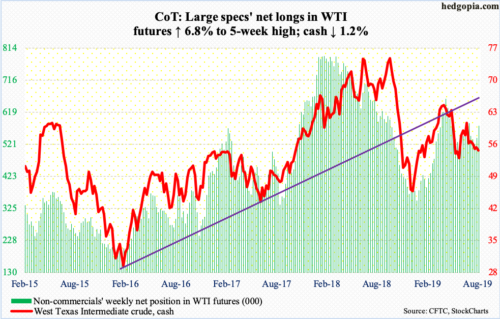
The cash ($54.17/barrel) closed out the week on trend-line support from last December, with breach risks rising. Intraday Wednesday, the crude retreated from $57.13. The 50- and 200-day moving averages are converging around just north of $56, which is proving tough to track. Support at $50-51 has gained in significance. The daily lower Bollinger band rests at $51.75.
The EIA report for the week of August 9 was mixed. For the third straight week, crude production remained unchanged at 12.3 million barrels per day. Crude imports dropped 496,000 bpd to 7.2 mbpd. Gasoline and distillate stocks rose – by 312,000 and 2.6 million barrels respectively to 234.1 million barrels and 138.1 million barrels. Crude stocks, on the other hand, fell 2.7 million barrels to 437.8 million barrels. Refinery utilization increased 1.1 percentage points to 95.9 percent.
E-mini S&P 500: Currently net long 56.6k, up 49.2k.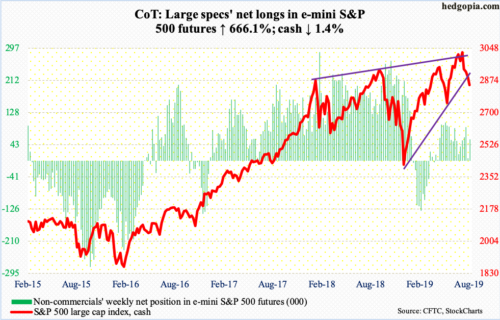
Last September, the cash (2847.11) tagged 2940.91 right before the October-December onslaught began. Post-December bottom, it rallied strongly but only to see sellers again show up at that level late April. This has also been the case the past three weeks, with Thursday touching 2939.08 intraday. The 50-day (2946.81) was right above.
Bulls’ inability to crack through this resistance follows a four-plus-percent rally from recent lows. Friday’s 2.6-percent rout sliced through trend-line support from last December’s lows. In the first half this month, support just north of 2800 was defended several times. The 200-day lies at 2802.52. A test looks imminent next week.
Medium- to longer-term, corporate buybacks are running a risk of switching from a tailwind to a headwind (more here).
Bulls are probably not happy how flows behaved this week. In the week through Wednesday, SPY (SPDR S&P 500 ETF), VOO (Vanguard S&P 500 ETF) and IVV (iShares Core S&P 500 ETF) lost a combined $2.9 billion (courtesy of ETF.com). In the same week, $12.2 billion came out of US-based equity funds (courtesy of Lipper).
Euro: Currently net short 38k, down 8.7k.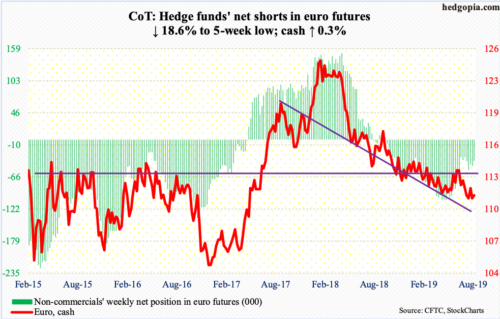
In 2015, eurozone banks had over €1 trillion in non-performing loans. By March this year, this had dropped to €643 billion, but remains sizable. With the eurozone economy showing signs of weakness, the ECB this week relaxed rules pertaining to NPLs – current and future. Banks will now have more time to set aside cash against bad loans. Minutes of the July meeting out this week hinted more stimulus measures are on the way.
The cash ($111.36) is no longer going down. In January last year, the euro tagged $125.37. On August 1 this year, it touched $110.27. A lot of the bad news is likely in the price, but bulls have struggled to put together a sustained rally. The daily has room to rally. Nearest resistance lies at $112, and then $113.
Gold: Currently net long 300k, up 9.9k.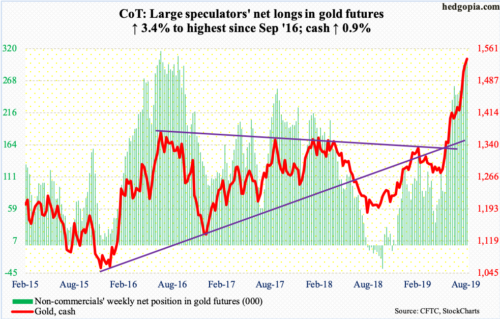
Last week’s intraday high of $1,546.10 ran into horizontal resistance from 2011-2013. Back then, the cash ($1,537.60/ounce) peaked at record $1,923.70 in September 2011 but began to come under severe pressure after it lost $1,540s-50s. The 0.9-percent rally this week was not enough to take out this resistance. It is worth watching.
In the meantime, non-commercials keep adding to net longs, and flows continue to pour in. In the week ended Wednesday, IAU (iShares Gold Trust) gained $206 million – its 9th positive week in 10. GLD (SPDR Gold ETF) took in $368 million; this followed outflows of $46 million in the prior week, which was the first negative week in 13 (courtesy of ETF.com).
Nasdaq 100 index (mini): Currently net long 23.6k, down 618.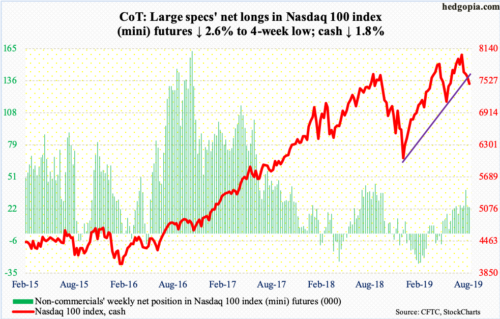
From recent lows, the cash (7464.99) rallied five-plus percent before hesitating at important resistance. This week, sellers showed up at the 50-day (7746.20), which approximates one-year horizontal resistance at 7700. Both Monday and Wednesday, a long-legged doji formed right underneath that average.
In the week to Wednesday, QQQ (Invesco QQQ Trust) lost $1.1 billion (courtesy of ETF.com).
Friday, the Nasdaq 100 collapsed 3.2 percent – ending right on a trend line from last December’s lows. In the prior couple of weeks, the index bounced right off of that support. A breach looks imminent next week. The daily is itching to go lower. Bulls need to save the 200-day at 7250.10.
Russell 2000 mini-index: Currently net short 63.5k, down 3.4k.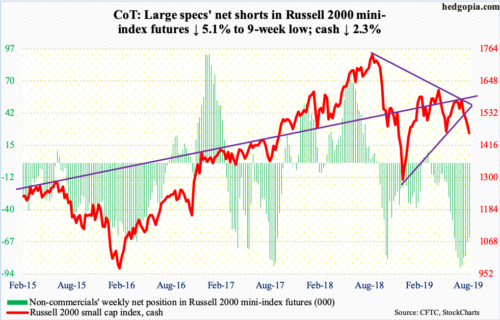
In the sell-off early this month, the cash (1459.49) lost both 50- and 200-day as well as trend-line support from last December’s lows. Amidst this, small-cap bulls stepped up to defend two-year horizontal support at 1450s. The rally since ran into trouble at the 200-day (1517.96). Thursday’s rejection at that average probably laid the foundation for Friday’s 3.1-percent smackdown. Once again, the Russell 2000 is clinging on to support at 1450s. It is a must-save for bulls, although odds are running against them.
US Dollar Index: Currently net long 29.5k, down 343.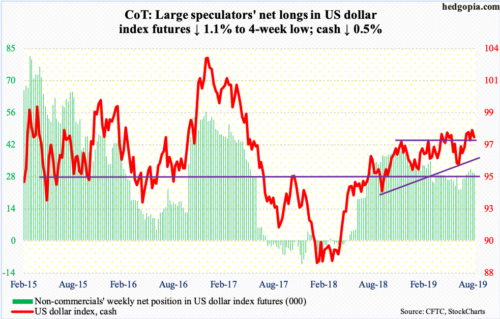
In the past several sessions, sellers persistently showed up at 98.20s, including Friday when the cash swung between 98.46 and 97.46, closing at 97.53. The daily is getting overbought. Support at 97.50s risks a breach.
VIX: Currently net short 59.5k, down 11.9k.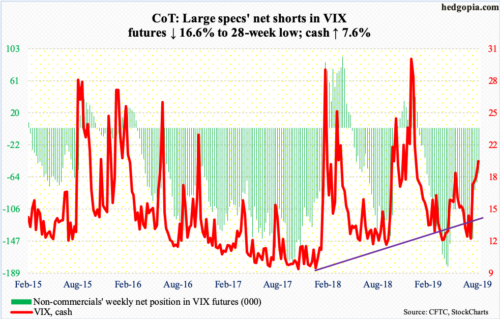
Volatility bulls defended the 50-day (15.67) both Wednesday and Thursday. Friday, the cash (19.87) took care of the 200-day (16.99). The daily is itching to go higher.
This scenario favors equity bears near term. Then they have to deal with the rather elevated 21-day moving average of the CBOE equity-only put-to-call ratio, which ended the week at 0.733. As this gets unwound, stocks can rally. On Christmas Eve last year, the ratio peaked at 0.744.


