
Most Important Price Point For Tech Stocks Since Dot.com Highs
(Click on image to enlarge)
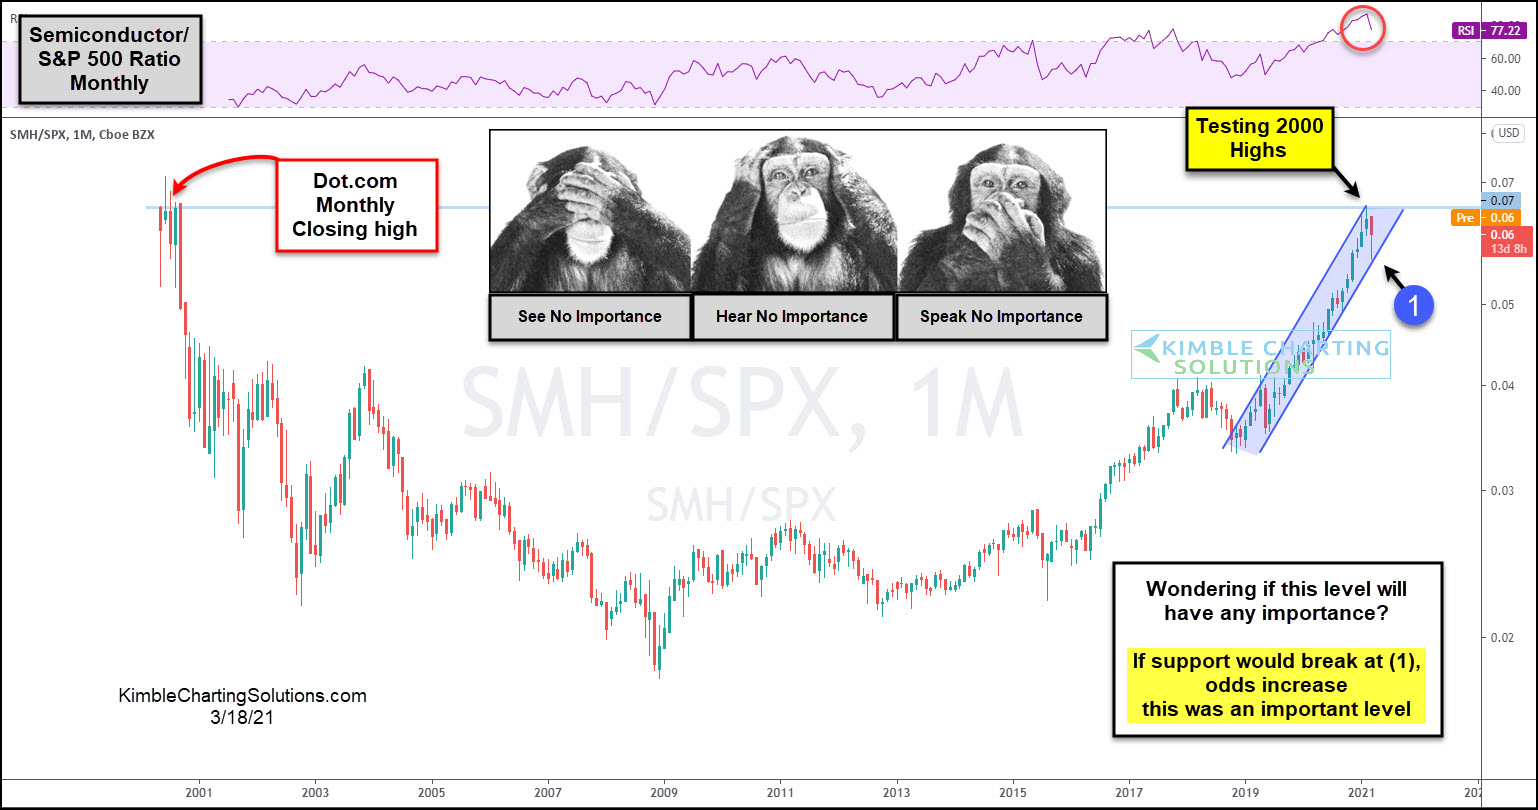
Are tech stocks hitting a long-term level that could become historically important? Possible!
This chart looks at the Semiconductor/S&P 500 ratio, on a monthly basis, over the past 20-years. The ratio peaked and rolled over in 2000, sending a bearish message to the tech sector.
How did tech stocks perform once this ratio started reflecting weakness in 2000? The Nasdaq lost over 80% of its value in the next two years.
Currently, the trend for the ratio is up as it has been in a bull market for the past 11-years, creating higher lows and higher highs. This ratio at this time is NOT sending a bearish message!!!
The bullish trend currently is testing the 2000 highs again, as monthly momentum (top chart) is at the highest level in history.
Is the ratio double topping and about to send an important message to tech stocks and the broad markets? Odds are low at this time that the trend is about to reverse.
Bottom line; If the ratio breaks below support at (1), odds increase this ratio is sending a very important message to tech stocks and the S&P 500!
Disclosure: Sign up for Chris's Kimble Charting Solutions' email alerts--click here.


