
More Uncertainty, As Stock Market Indexes Trade Along New Record Highs
Briefly:
Intraday trade: Our Wednesday's intraday trading outlook was neutral. It proved accurate because the S&P 500 was unchanged following neutral opening of the trading session. The index extended its short-term consolidation. We still can see some short-term technical overbought conditions. However, the index continues to trade relatively close to its record highs. Therefore, we prefer to be out of the market again, avoiding low risk/reward ratio trades.
Our intraday outlook is neutral today. Our short-term outlook is neutral, and our medium-term outlook is neutral:
Intraday outlook (next 24 hours): neutral
Short-term outlook (next 1-2 weeks): neutral
Medium-term outlook (next 1-3 months): neutral
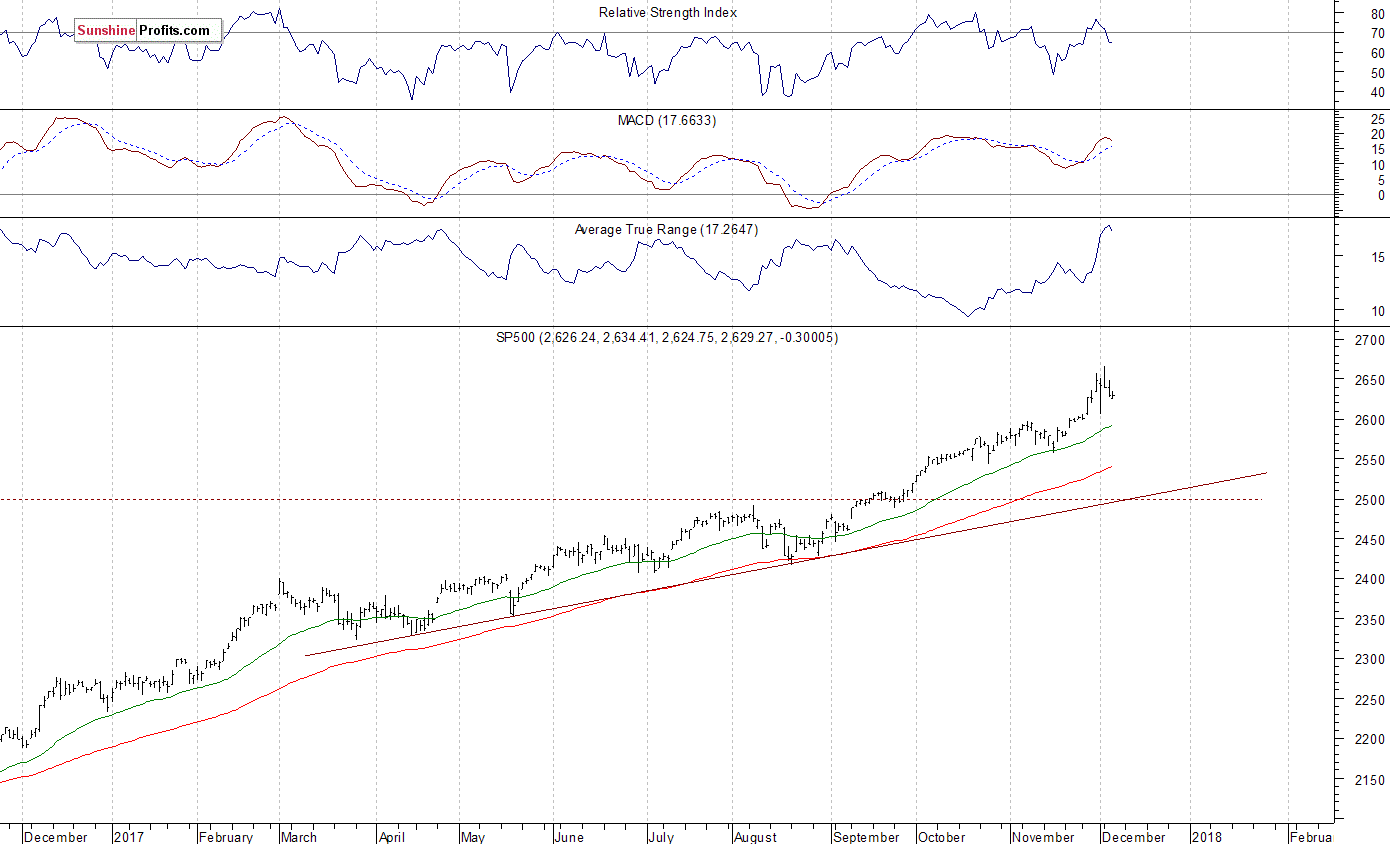
The main U.S. stock market indexes were mixed between -0.2% and +0.2% on Wednesday, as investors continued to hesitate following recent fluctuations along new record highs. The S&P 500 index extends its short-term consolidation along the level of 2,650. It trades around 1.3% below Monday's new record high of 2,665.19. The Dow Jones Industrial Average was relatively weaker than the broad stock market once again, as it lost 0.2% and got closer to 24,000 mark, retracing its Monday's rally to new record high of 24,534.04. The technology Nasdaq Composite was relatively strong, as it gained 0.2%. It remains within a short-term consolidation along the level of 6,800-6,900. The nearest important level of support of the S&P 500 index remains at around 2,625-2,630, marked by recent fluctuations. The next support level is at 2,600-2,610, marked by Friday's local low. The support level is also at 2,590, marked by last Tuesday's daily gap up of 2,584.64-2,589.17. On the other hand, resistance level is at 2,650, marked by previous support level. The next level of resistance is at around 2,660-2,665, marked by all-time high. Will the S&P 500 index continue its uptrend? Or is this some volatile topping pattern before medium-term downward correction? There have been no confirmed negative signals so far. However, we still can see medium-term technical overbought conditions along with negative technical divergences:
(Click on image to enlarge)
Mixed Expectations
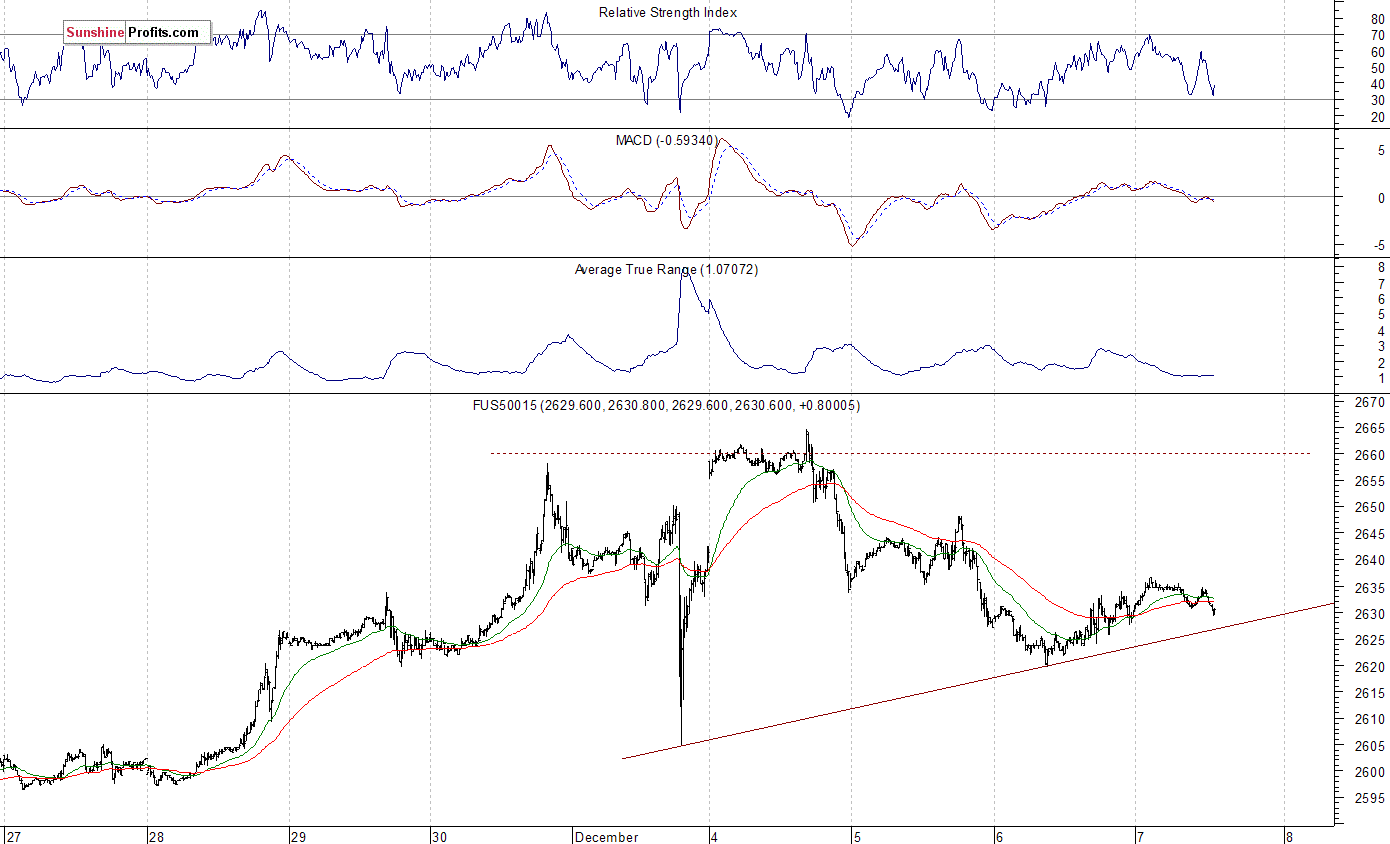
Expectations before the opening of today's trading session are mixed, with index futures currently between -0.1% and +0.3% vs. yesterday's closing prices. The European stock market indexes have gained 0.1-0.3% so far. Investors will wait for the Initial Claims number release at 8:30 a.m. The market expects that it was at 239,000 last week. The S&P 500 futures contract trades within an intraday consolidation following overnight advance. The nearest important level of resistance is at around 2,635, marked by short-term local high. The next resistance level is at 2,640-2,645, marked by Tuesday's intraday consolidation. On the other hand, support level is at 2,600-2,620. The futures contract is slightly above its short-term upward trend line, as the 15-minute chart shows:
(Click on image to enlarge)
Nasdaq Relatively Stronger
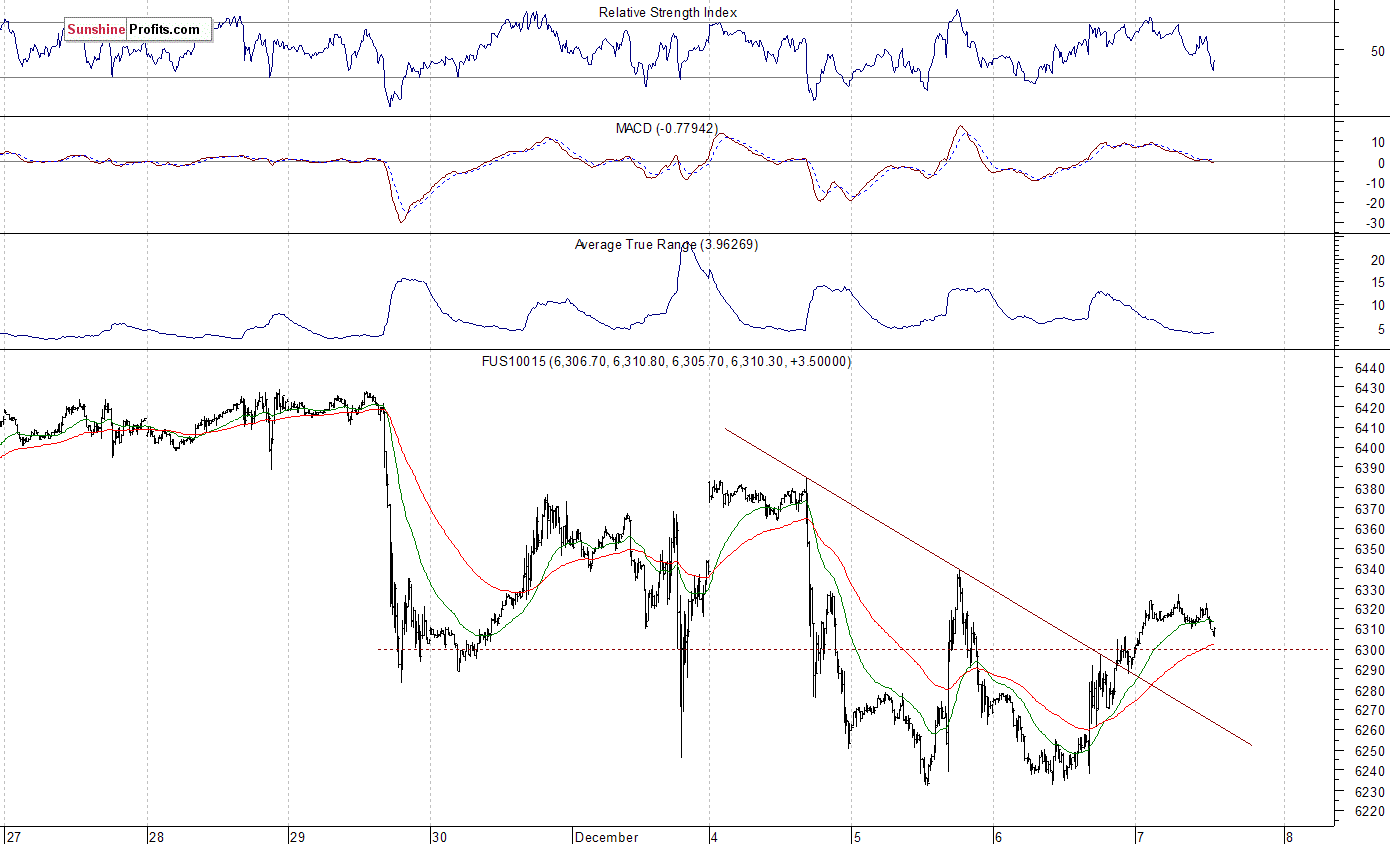
The technology Nasdaq 100 futures contract trades within an intraday consolidation following yesterday's move up. The market bounced off support level at around 6,230-6,250, marked by recent local low. The nearest important level of support is at around 6,280-6,300, marked by previous resistance level. On the other hand, level of resistance is now at 6,330-6,350, marked by local highs. The Nasdaq 100 futures contract trades along 6,300 mark, as we can see on the 15-minute chart:
(Click on image to enlarge)
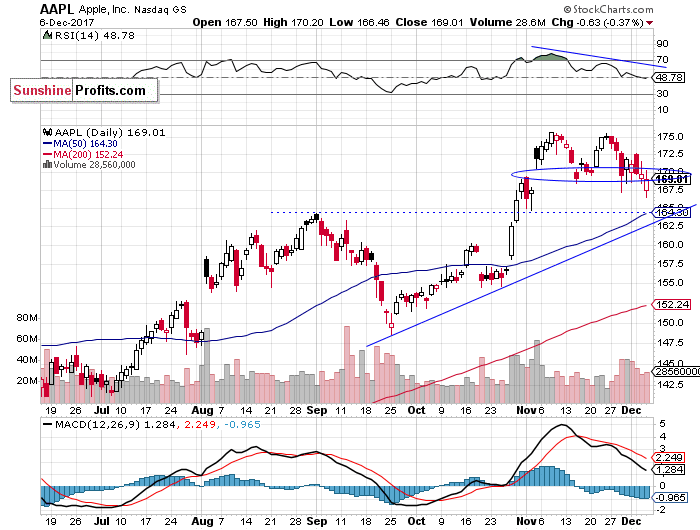
Let's take a look at Apple, Inc. stock (AAPL) daily chart (chart courtesy of http://stockcharts.com). The price reached new record high on November 8, as it extended its uptrend following better-than-expected quarterly earnings release. Since then it fluctuated below the record high. Is this a topping pattern or just consolidation before another leg up? The price broke below support level, marked by the early November daily gap up yesterday. However, it continues to trade along that support level:
(Click on image to enlarge)
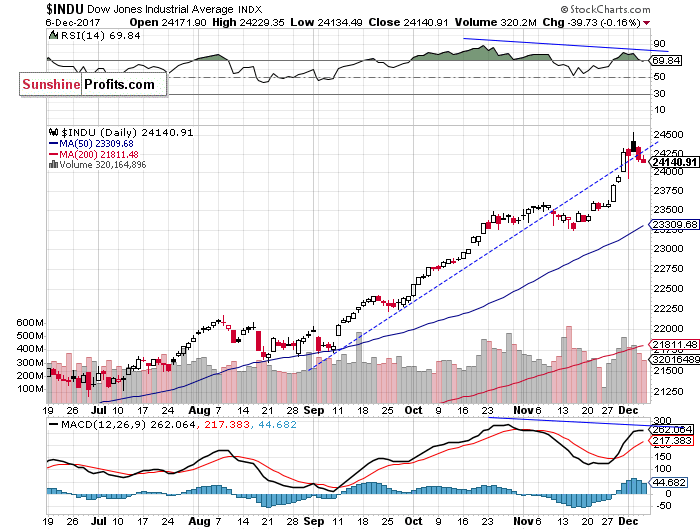
The Dow Jones Industrial Average daily chart (chart courtesy of http://stockcharts.com) shows that blue-chip index broke above its recent consolidation and reached new record highs above 24,000 mark recently. It slowly retraces some of its move up, as it gets closer to 24,000 mark again. We still can see negative technical divergences. The most common divergences are between asset’s price and some indicator based on it (for instance the index and RSI based on the index). In this case, the divergence occurs when price forms a higher high and the indicator forms a lower high. It shows us that even though price reaches new highs, the fuel for the uptrend starts running low:
(Click on image to enlarge)
Concluding, the S&P 500 index was unchanged on Wednesday, as investors continued to take profits off the table following recent run-up. We still can see medium-term overbought conditions along with negative technical divergences. However, there have been no confirmed negative signals so far. Is this a topping pattern or just another consolidation within an uptrend?
Disclosure: None.


