
More Than Meets The Eye Happening Here
I attended a holiday gathering for one of my advisor clients on Friday evening. While everyone appeared to be in the spirit of the season, when the conversation eventually turned to the market action, the mood quickly changed.
In talking with fellow financial professionals throughout the evening, the theme of the conversations was consistent. To a man, everyone agreed that (a) this was the worst market they'd seen in a VERY long time, (b) the action "felt" like an old-school bear (relentless selling, no lift, no obvious catalysts), and perhaps more importantly, (c) there is more going on here than meets the eye.
The latter is a lesson we learned from the 2007-09 financial crisis. Honestly, before then, very few investment managers (including yours truly) had ever heard of the now-famous alphabet soup of derivative securities or the "mark to market" rule that combined to nearly crush the global banking system.
Today, we all know that "forced selling" (fund blowups, margin calls, and a myriad of programmatic systems) can cause markets to collapse into a vacuum as buyers simply stand aside when the algos begin to roll and/or folks "need" to sell at any price.
But, on Friday evening, everyone agreed that this market definitely feels different. The point is that since 2011 - the time when many believe that high speed algo trading began to dominate the market landscape - all episodes of "forced selling" eventually ended and after a couple of days, a "face ripping" rallied tended to ensue. But this time, as the group said in unison, "there is NO LIFT at all." ALL intraday rallies are sold into - within minutes.
The group further opined that this market appears to be different than even the 2011 whipsaw party, where the market moved up and down and down and up in what Tony Romo might call large chunks. The difference was that those trends moved in a straight line and then reversed and went the other way - with reckless abandon in both directions. In my humble opinion, this was news-driven (U.S. debt downgrade, Europe crisis, etc.), high-speed trend-following at its finest. But again, the current action feels different.
Since December 3rd, the market has indeed moved in a straight line, becoming what is referred to as a "waterfall decline" in the process. But, there are no headlines to trigger the moves. No, something else appears to be at work here. And the real problem is no one is really sure what that "something" is.
So, this morning, I thought I'd run through some of the possibilities kicking around in my head. There are three.
Premise #1: It's the Earnings, Stupid
One narrative being bandied about is the slowdown in earnings growth could be worse than anticipated - especially given what is happening to oil again.
Mathematically, it is obvious that EPS growth for the S&P 500 had to fall given the 25%+ growth we saw in 2018. Everybody knows that a healthy chunk of that growth was attributable to the tax cuts and as such, won't recur. This isn't the problem. Remember, something everybody knows isn't really worth knowing in this business (because it's already priced into the market).
I think the real problem is that EPS could fall significantly more than the market has been expecting. Think about it... Higher interest rates. Tariffs. Rising wages. Economic slowdown. Any of these - and especially a combination of these - could impact corporate profits (and not in a good way).
As Exhibit A in my thesis, below is a chart of Consensus Estimates for S&P GAAP EPS.
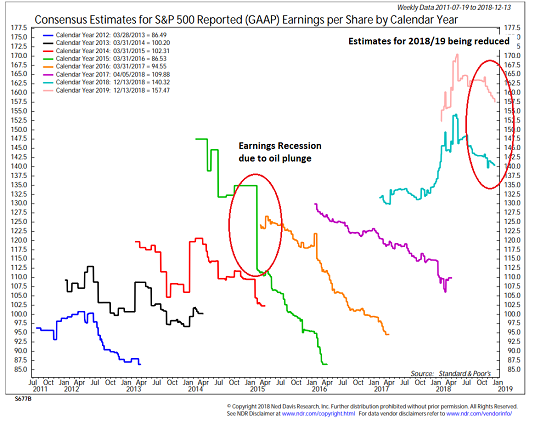
View Full Size Chart Online
Source: Ned Davis Research
Note the accelerated decline of the salmon-colored line in the upper right. This shows that the GAAP (generally accepted accounting principles) version of EPS estimates are falling - fast.
From my seat, the real problem is that these estimates may need to fall even more - and even faster.
The reasons? #Oil and #GrowthSlowing.
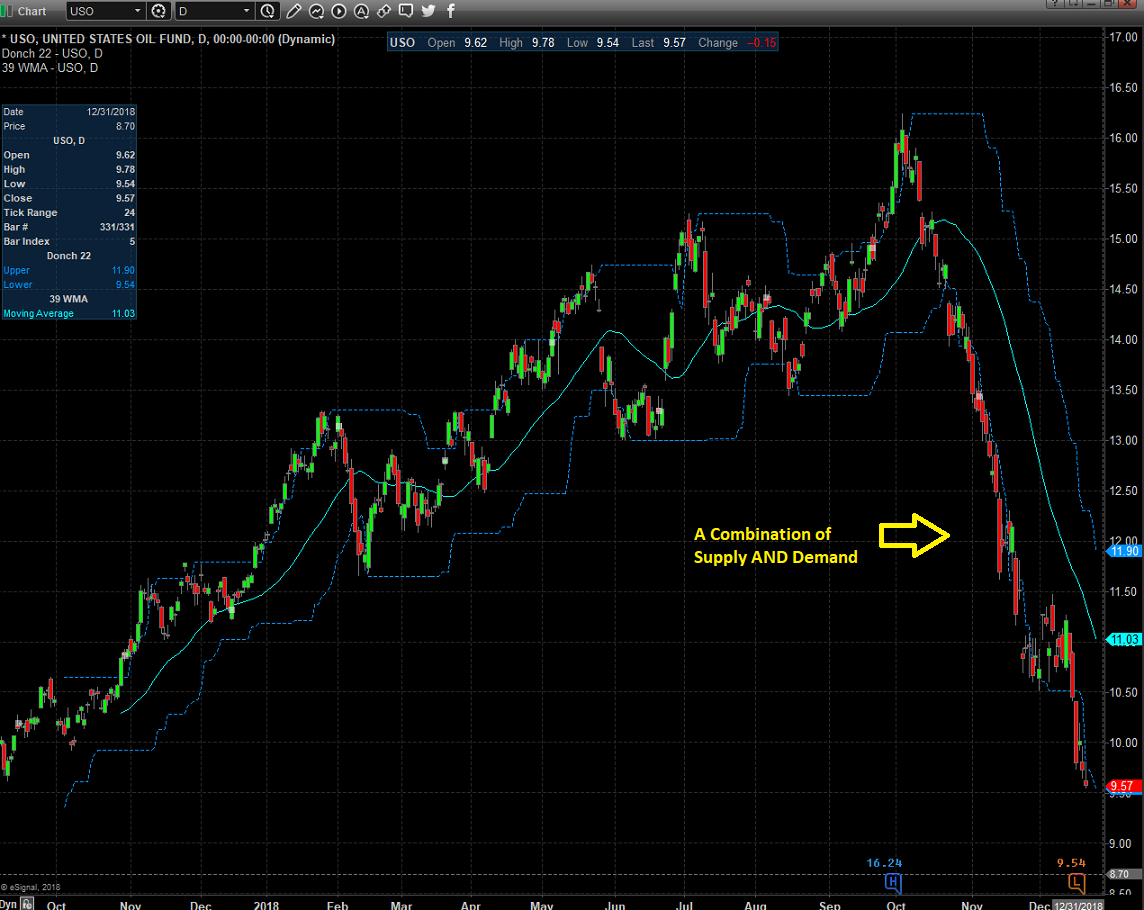
Oil's Dance To The Downside
Don't look now fans, but oil is cratering again. Not like it did in 2014/15, but the USO (United States Oil Fund ETF) has plunged -41% since October 3rd. Yowza - talk about moving in a straight line!
US Oil Fund ETF (USO) - Daily

The obvious question here is, what's up with oil? In the beginning of this move, there was a lot of talk about supply being the culprit for the precipitous decline. However, as the dive has progressed, traders have come to the conclusion that the real issue appears to be demand. As in slowing global growth means less demand for oil. Ugh.
So, if oil is flat-out plunging due to the perception of slowing global demand, how long will it be before demand for other stuff starts to slow? Exactly.
Premise #2: The Fed Overshoot Is On "Autopilot"
Another issue that I need to credit analyst extraordinaire Larry McDonald for is the idea that despite all the yammering from Fed officials, the markets are "really" staring at the equivalent of at least 7 rate hikes in 2019. Wait, what?
Here's the deal. The Fed is in the process of "unwinding" their balance sheet. I.E. Selling off all the stuff they bought during nearly a decade of QE. In English, the Fed is selling $50 billion a month of the bonds and other securities it has on its "balance sheet." My quick math mind says that's $600 billion a year. Every year.
The goal is to return the Fed's balance sheet back toward "normal." I get it. Makes sense.
The problem is this has NEVER been done before. Oh, and this process amounts to a little something called "QT" (quantitative tightening). As the moniker suggests, the selling of bonds effectively represents a "tightening" of monetary conditions. Whether it was intended to or not.
To put this into perspective, let's remember that $600 billion represents approximately 75% of the total amount of bonds on the Fed's balance sheet pre-crisis. And they are going to be selling this amount each and every year. Hmmm...
Here Comes The Big Point
McDonald estimates that the selling of approximately $85 billion in bonds is the equivalent of a 0.25% hike in the Fed Funds Rate. So, if my calculator is correct, the Fed's "runoff" plan (the selling of $50 billion in bonds each month) will become the equivalent of 6.9 rate hikes in 2019. Yikes.
Perhaps the biggest issue here is Jay Powell has told us that the "runoff" is on "autopilot." The impression is that the quantitative tightening, which represents significantly more tightening that the Fed has implemented over the past two years, is not up for discussion.
This, dear readers, is a problem. A big problem. Because one of the baseline fears of this bear market is the Fed would overshoot - like they always have in the past - and wind up pushing the economy into recession. And while folks like me argued that the Fed wouldn't be dumb enough to go "too far," this "autopilot" QT thing could easily become the "unintended consequence" of the great post-crisis QE experiment.
Now let's add in the 2 actual hikes that Powell & Co. are talking about. It quickly becomes clear that the fear of a "Fed Overshoot" is well, real. And I'll bet dollars to donuts that this a point very few investors or financial pros are aware of. But apparently, the algos are.
But Wait, There's More...
Now couple the Fed's balance sheet reduction plan with the massive increase in low quality debt issued in recent years, the $1 trillion in government bonds the U.S. needs to sell in 2019, the instability of banks Europe (have you seen a chart of DB lately?) and the fact that QE is ending everywhere (except Japan, of course). And while I consider myself a card-carrying member of the-market's-glass-is-half-full club, even I must admit to the possibility that another credit crisis could be lurking.
So... Cue the 500-point temper tantrums in the stock market and the dive in bond yields over the Fed's current course.
The good news is that in a CNBC interview Friday morning, New York Fed President, John Williams suggested that the Fed's current plan to sell $50 billion in bonds each month is not set in stone and that the Fed can be flexible if need be. The headline sparked a rally and the Dow surged more than 300 points in the next 9 minutes. This was certainly encouraging. Well, for about 10 minutes anyway, as the selling then resumed in earnest and continued throughout the day and into the close.
Since the Dow finished down 414 on the day (representing a reversal of more than 800 points), one can argue that markets want more than "hints" or "jawboning" on this subject. Especially since the "autopilot" verbiage had been used by the Fed Chair just two days prior.
Premise #3: What If...
And finally, there is the underappreciated worry behind door number 3. This one comes from the Wall Street Journal's Greg Ip. During a CNBC segment Friday afternoon, Ip pondered aloud the following: What if 2018's 3% growth in the U.S. economy was a "head fake?"
Ip pointed out that up until 2018, the U.S. economy had been muddling along at what First Trust's Brian Wesbury dubbed a "plow horse" pace. And if one mixes in the slowdown in global growth (remember, Germany, Japan, and Switzerland already have one quarter of negative GDP growth under their belt), the trade war, the potential for political risk in D.C., etc., it isn't much of a stretch to think that the U.S. economic growth, like earnings, could slow more than the markets have been anticipating. Super.
But Near-Term, A Bounce is Due
From my seat, these three underappreciated fears help "esplain" the waterfall decline in the stock market and are reasons that the bears could stick around for a while (I'm thinking 3-6 months).
But let's keep in mind that the current dance to the downside has clearly gotten out of hand. For example, the S&P 500 fell -7% last week alone, qualifying as the worst week since 2008. This is now the worst December since 1931. The NASDAQ is now -21.9% off its high and into what the press calls a bear market.
The key is the December destruction has created a seriously oversold condition on all major time-frames, put negative sentiment at extreme levels, and created what could be construed as a "washout" on Friday with the VIX climbing over the all-important 30-level.
On this front, an argument that extreme sentiment levels have set in comes from SentimenTrader. The tweet below suggests that smaller investors were panicking last week and that stocks tend to rally nicely going forward...
This past week, the smallest of options traders bought to open 2.9 mln put options. That's 27% of their options volume. Since January 2000, only five other weeks saw them panic this much. pic.twitter.com/mrN1AA3eus
— SentimenTrader (@sentimentrader) December 22, 2018
As the table points out, the market has rallied +4.84% on average over the next week and +7.46% over the next two weeks after cases of smaller investors panicking to buy put options.
There is similar research from Bespoke Investment Group. The chart below shows what happens to the S&P 500 after quarters in which the index has fallen 10% or more.
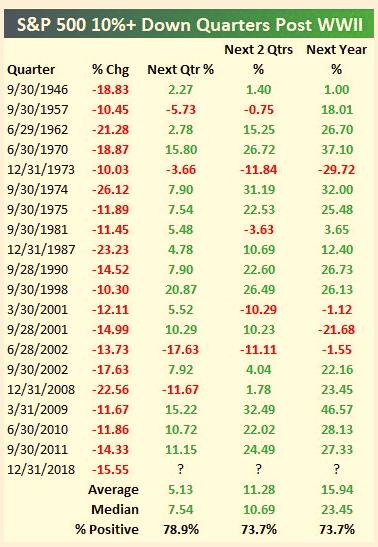
View Chart Online
Source: Bespoke Investment Group
And to finish off the topic, here are some stats to consider from Ned Davis Research. Since 2000, when S&P is down -13% or more over 63 trading days (there have been 5 prior occurrences), the market has moved higher 4 out of 5 times over the next 5 and 10 days. The average gain for the S&P has been +3.48% over next 5 days and +1.6% over the next 10 days. Over ensuing 21 and 63 days, the index has moved up 3 out of 5 times with an average gain of +1.4% over the next 21 days and +2.5% over the next 63 days.
As such, it is easy to say the bulls are due. Really due.
Here's wishing everyone a very Merry Christmas!
Now let's turn to the weekly review of my favorite indicators and market models...
The State of the Big-Picture Market Models
I like to start each week with a review of the state of my favorite big-picture market models, which are designed to help me determine which team is in control of the primary trend.
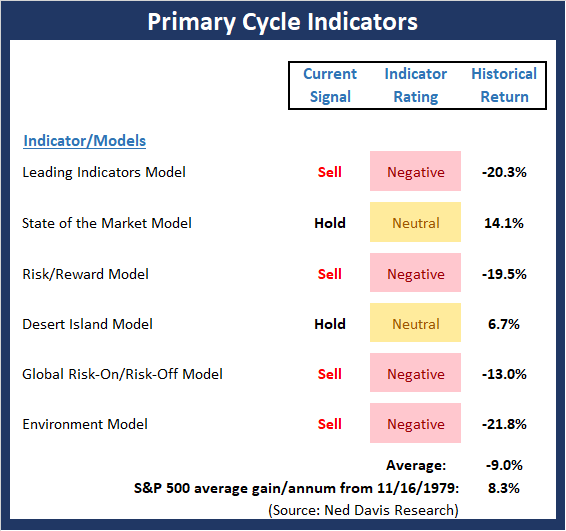
View My Favorite Market Models Online
The Bottom Line:
- There were more important changes to the Primary Cycle board this week. First, the Leading Indicators model flashed a sell signal early in the week. Next, the reading of our long-term "State of the Market" model (which is designed to call major bulls/bears), fell out of the positive zone. In addition, the historical average annualized return of the market fell further, currently standing at -9%.
The bottom line message from this board is clear: It's a bear market that is likely to persist for several months.
This week's mean percentage score of my 6 favorite models declined to 41.9 (from 47.8, 2 weeks ago: 53.6%, 3 weeks ago: 57.9%, 4 weeks ago: 64.5%) while the median fell to 44.2% (from 45%, 2 weeks ago: 55%, 3 weeks ago: 52.5%, 4 weeks ago: 65%).
The State of the Trend
Once I've reviewed the big picture, I then turn to the "state of the trend." These indicators are designed to give us a feel for the overall health of the current short- and intermediate-term trend models.
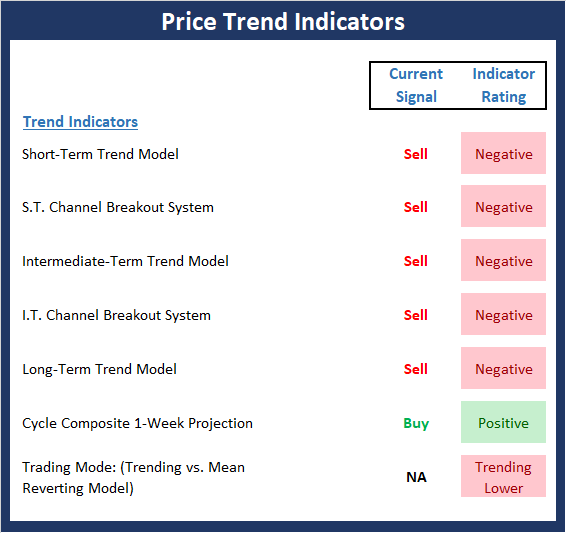
View Trend Indicator Board Online
The Bottom Line:
- One glance at the Trend board really says it all. Although the seasonal cycles point higher next week, the rest of the board sports a bright shade of red. Last week, we opined that if the S&P 500 should break and hold below the February lows for more than a couple days, the odds that the current corrective phase will morph into a cyclical bear would increase dramatically. I believe we can make a check mark here and declare this an overwhelmingly negative environment.
The State of Internal Momentum
Next up are the momentum indicators, which are designed to tell us whether there is any "oomph" behind the current trend.
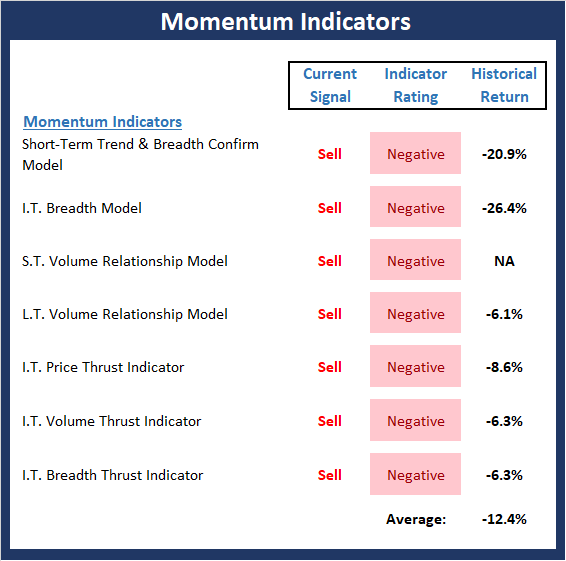
View Momentum Indicator Board Online
The Bottom Line:
- To be clear, the unanimous negative readings seen in the Momentum board are first, rare, and second, confirmation of the fact that conditions are extremely weak. As I wrote last week, the good news is that this type of condition tends to lead to countertrend rallies. Historically, the odds of a strong rally in the near-term are now very strong. But the bad news is the severity of the damage done means it will take time for the market to recover. Thus, we should expect several months of basing action (i.e. violent rallies and retests) before the tide will turn.
The State of the "Trade"
We also focus each week on the "early warning" board, which is designed to indicate when traders might start to "go the other way" -- for a trade.
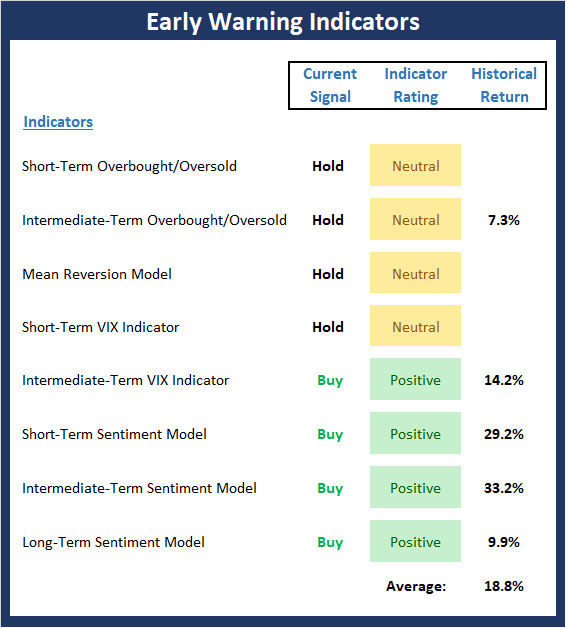
View Early Warning Indicator Board Online
The Bottom Line:
- Last week I opined that from a shorter-term perspective, the "Early Warning" board is now sending a clear signal that a countertrend rally could begin at any time. And yet with the market experiencing a waterfall decline, the board sports less green this week. While it may sound counterintuitive, it is important to keep in mind that the key to mean reversion indicators is for them to first reach an extreme reading and then - and this is the important part - reverse. Last week's decline pushed several indicators farther into the extreme reading zones and out of the "reversals" that had been apparent the week before.
The bottom line here is the table remains set for a strong countertrend rally.
The State of the Macro Picture
Now let's move on to the market's "environmental factors" - the indicators designed to tell us the state of the big-picture market drivers including monetary conditions, the economy, inflation, and valuations.
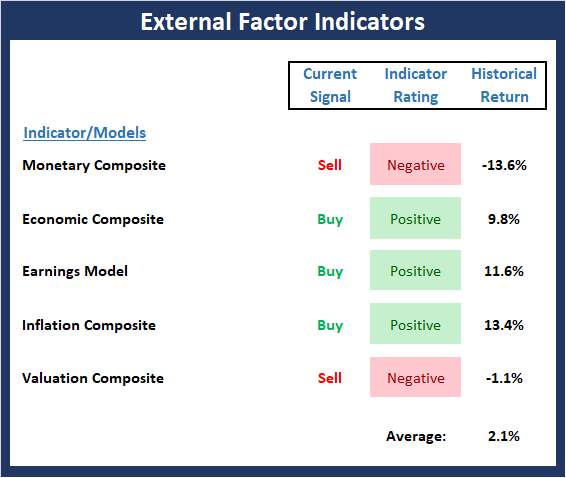
View Environment Indicator Board Online
The Bottom Line:
- There are no obvious changes to the External Factors board this week. However, under the surface, there is some movement. First, we see improvement brewing in the monetary models as rates pull back from their highs and the Inflation Composite continued to move lower last week, suggesting that inflation is NOT a concern. However, it is worth noting that the earnings component, while still in the green zone, is starting to move lower as earnings estimates for both 2018 and 2019 are moving lower at a fairly steep rate. This is likely one of the market's primary concerns from a macro perspective.
Disclosure: At the time of publication, Mr. Moenning held long positions in the following securities mentioned: none - Note that positions may change at any time.
The opinions and forecasts ...
more

