
Monthly Candles A Warning Shot Across Equity Bulls’ Bow; March Could Be Interesting
Two months into the year, January and February have traded similarly – early strength followed by weakness in the dying sessions. Equity bulls’ inability to hold on to gains comes amidst a spike in long rates. Short rates are behaving, but if the economy performs as expected, markets will begin to demand higher rates on the short end as well. A catch-22 is in play.
The year 2021 was quick off the blocks – essentially picking up where it left off. Last year, the S&P 500 (SPX) rallied 16.3 percent. In the first five sessions this year, it then rose 1.8 percent – passing the five-day rule, which posits that as go the first five sessions so goes the year. By the 26th, the large cap index was up 3.1 percent, to an intraday high of 3870.90. Then it hit the skids. By the time the month was over, it was down 1.1 percent.
As a result, the January barometer, which states that January predicts the rest of the year, was forecasting a down year. Although it must be pointed out that not all the major US equity indices ended up in the red in January. The Nasdaq Composite (COMP), for instance, rose 1.4 percent, although it too gave back most of the gains.
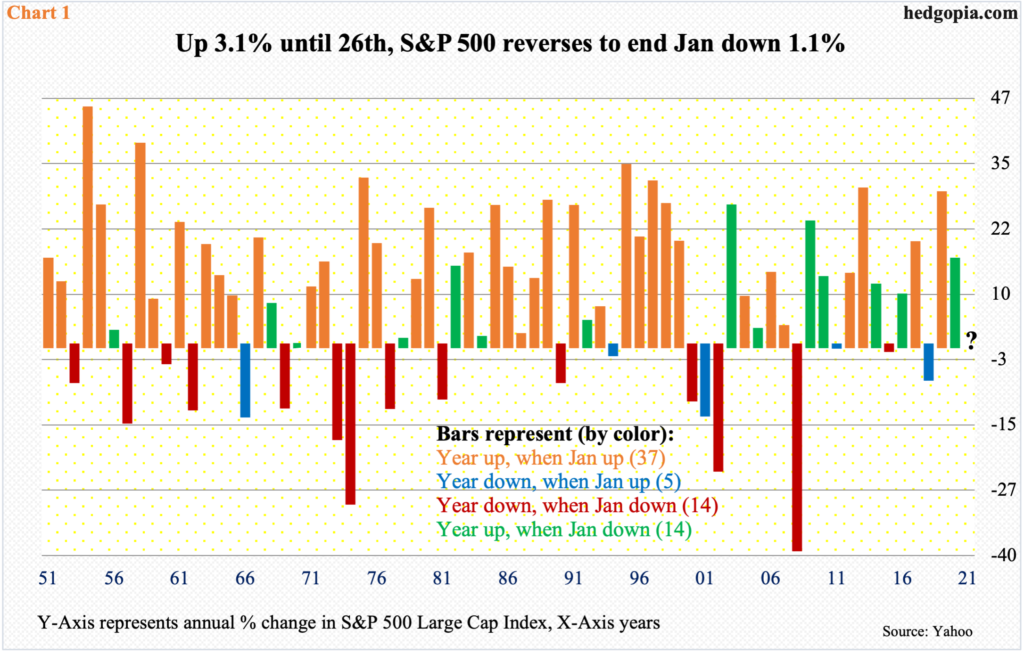
Further, the track record of a down January is mixed. Chart 1 plots the annual returns for the S&P 500 going back 70 years, to 1951. The year 2021 is marked with a question mark. The data is divided into four buckets: (1) years that were up when January was up, (2) years that were down when January was up, (3) years that were down when January was down, and (4) years that were up when January was down. In parenthesis is the number of years corresponding to each bucket.
It turns out the barometer’s success rate is very high when the month is up. Out of the 70 years, there have been 42 years in which January was up. Out of those 42, the index went on to have a positive year in 37 of them; only five were down.
January was down in 28 of the 70, of which 14 ended up for the year and 14 down – essentially a coin toss.
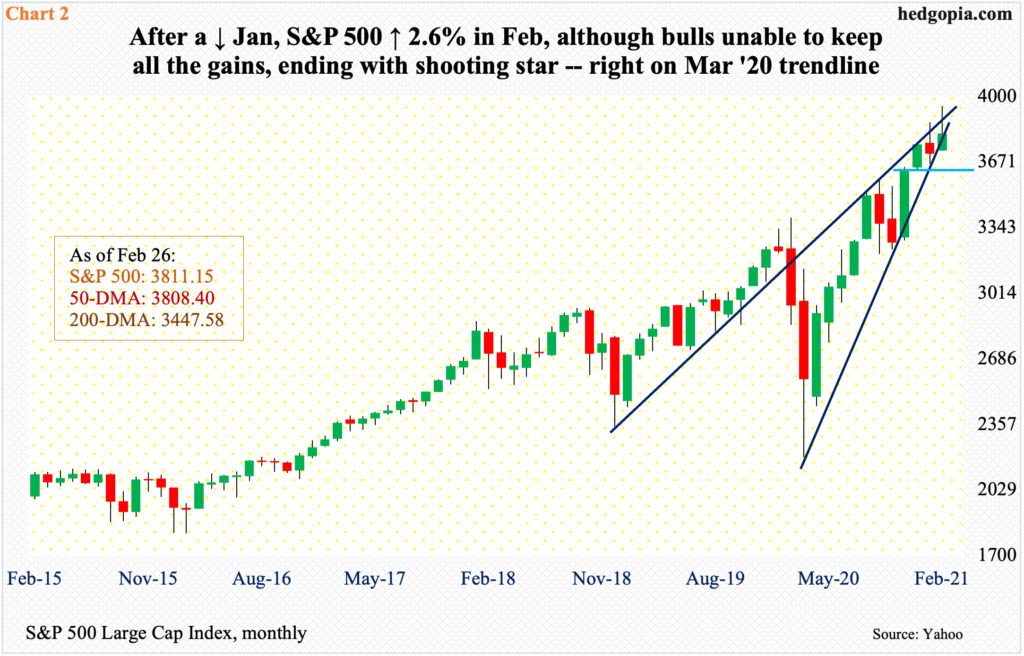
January’s volatile trading helped form a monthly spinning top, ending the month right on a crucial trend line from last March (Chart 2).
Last March, after a five-week, 35-percent collapse, the S&P 500 bottomed on the 23rd. Through the intraday all-time high of 3950.43 on February 16, the large cap index rallied 80 percent! February traded similar to how January behaved. Through that high, the month was up 6.4 percent. Then, sellers showed up. When it was all said and done, the gains were cut down to 2.5 percent. In the end, a monthly shooting star was formed. Sellers are showing up.
The last three months, they showed up at a rising two-year trend line. From bulls’ perspective, the good thing is that the aforementioned March trend line is intact. At the end of January, the trend line was vigorously defended. This is being tested again. The 50-day moving average (3808.40) is right there.
Immediately ahead, a loss of the March trend line opens the door toward 3640s, which is where the S&P 500 (3811.15) peaked on November 9 when Pfizer (PFE) announced its positive vaccine news.
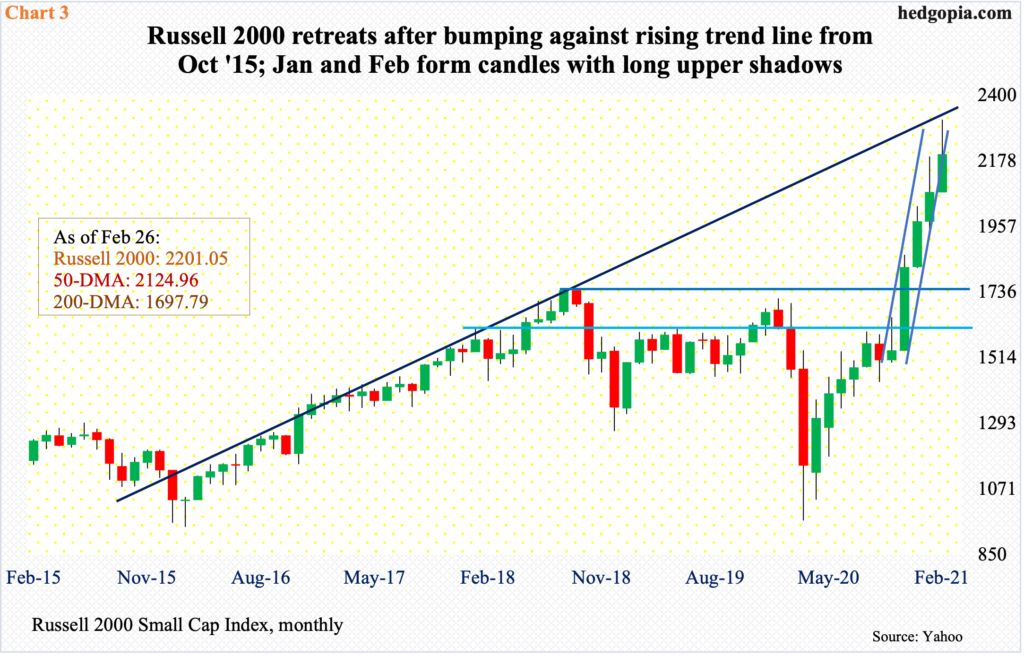
Sentiment around small-caps in particular improved big time around that time. The Russell 2000 (IWM) was already beginning to act better post-November 3 presidential election. But the PFE news gave it a real boost, breaking out of 1600-plus, where resistance went back to January 2018. One week after PFE’s announcement came a similarly positive vaccine news from Moderna (MRNA). This helped the small cap index take out another resistance – this time 1740s, which was a prior high from August 2018 (Chart 3).
In fact, the Russell 2000 has essentially gone parabolic the last four months, trading within a steep ascending channel. At the end of January, it landed right on the lower bound of that channel, and this was defended, subsequently rallying the index toward the upper bound. On February 10, a new intraday high of 2318.09 was posted before retreating.
Bulls’ resolve was once again tested last week, as the index (2201.05) slightly fell out of the channel. There is short-term horizontal support at 2150s-2160s, which was tested last Friday. After this, the 50-day lies at 2124.96.
More importantly, both January and February showed investor willingness to sell the highs.
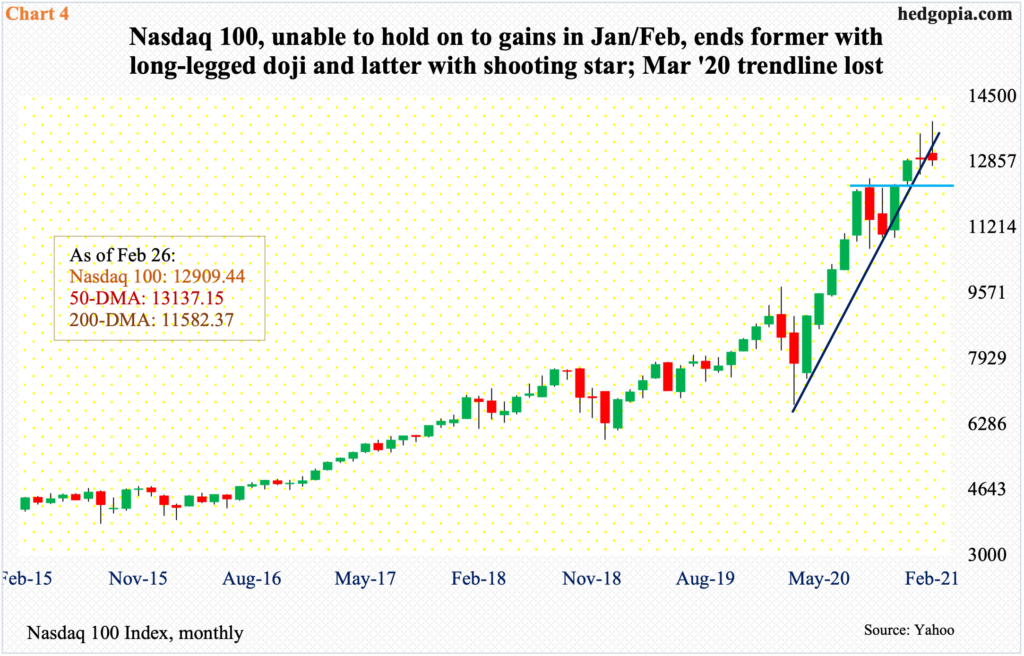
This was most evident on the Nasdaq 100 (NDX). Through the 25th in January, the index was up 5.2 percent, but in the end this was reduced to a gain of mere 0.3 percent. The month produced a monthly long-legged doji. February evolved similarly. From up 7.4 percent to down 0.1 percent, the index suffered quite a reversal, forming a monthly shooting star (Chart 4).
February’s uptrend reversed on the 16th as the index posted a new intraday high of 13879.77. In the next five sessions – that is, by last Tuesday – it quickly dropped to 12758.12, which was bought, reclaiming a rising trend line from last March’s low, but only to decisively lose it on Thursday. The 50-day (13137.15) is lost as well.
This is different from early last month when this trend line was aggressively defended. As things stand, both the weekly and monthly remain way overbought. Immediately ahead, support lies at 12430s. This is where the Nasdaq 100 (12909.44) peaked on September 2 before coming under decent pressure.
The importance of how the Nasdaq 100 behaves needs no elaboration. The top six companies in the S&P 500 are all tech: Apple (AAPL), Microsoft (MSFT), Amazon (AMZN), Alphabet (GOOG), Facebook (FB) and Tesla (TSLA). Combined, they account for 23 percent of the index. In the Nasdaq 100, their combined share is nearly 44 percent. As they go, so go these indices, as they are weighted by their market cap.
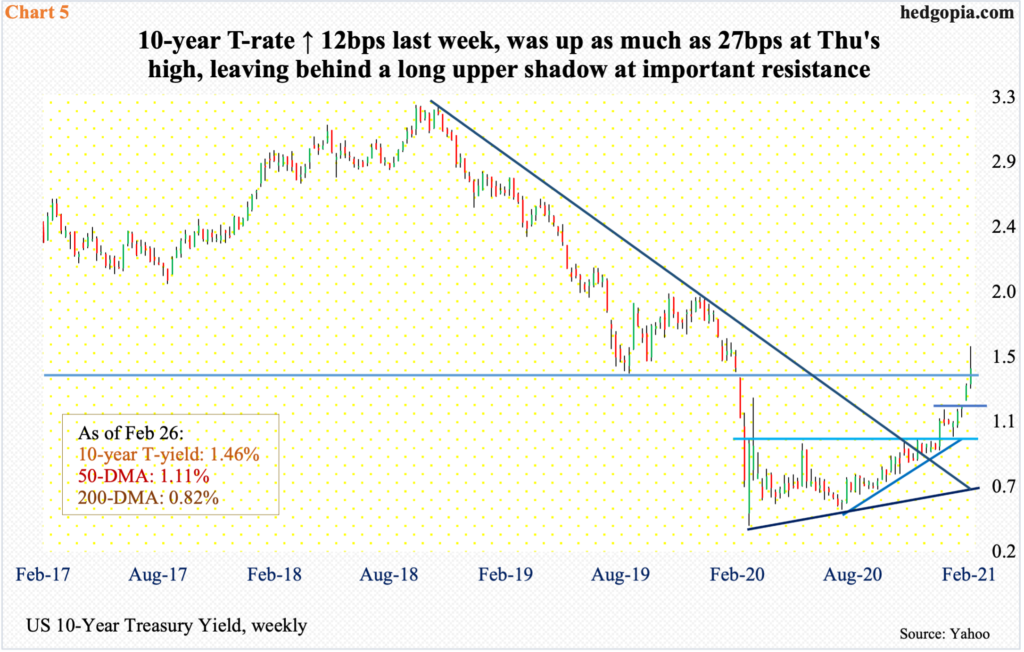
The latest weakness in stocks came amidst rate increases on the long end of the yield curve. Last week, the 10-year treasury yield (1.46 percent) rallied 12 basis points and was up as much as 27 basis points at Thursday’s high when rates reached 1.61 percent – a one-year high. Until January 5, these notes were yielding sub-one percent (Chart 5).
Currently, most of the action is in the long end, with some in the belly as well. Last Thursday, the two-year T-yield rose five basis points to 0.17 percent, but by Friday it was back at 0.12 percent. This rate tends to be the most sensitive to the benchmark rate. The fed funds rate remains suppressed in the range of zero to 25 basis points.
As far as financial assets are concerned, a reassessment will follow once the short end makes a move. Historically, these rates will lead the Fed.
This is the catch-22 in the current context.
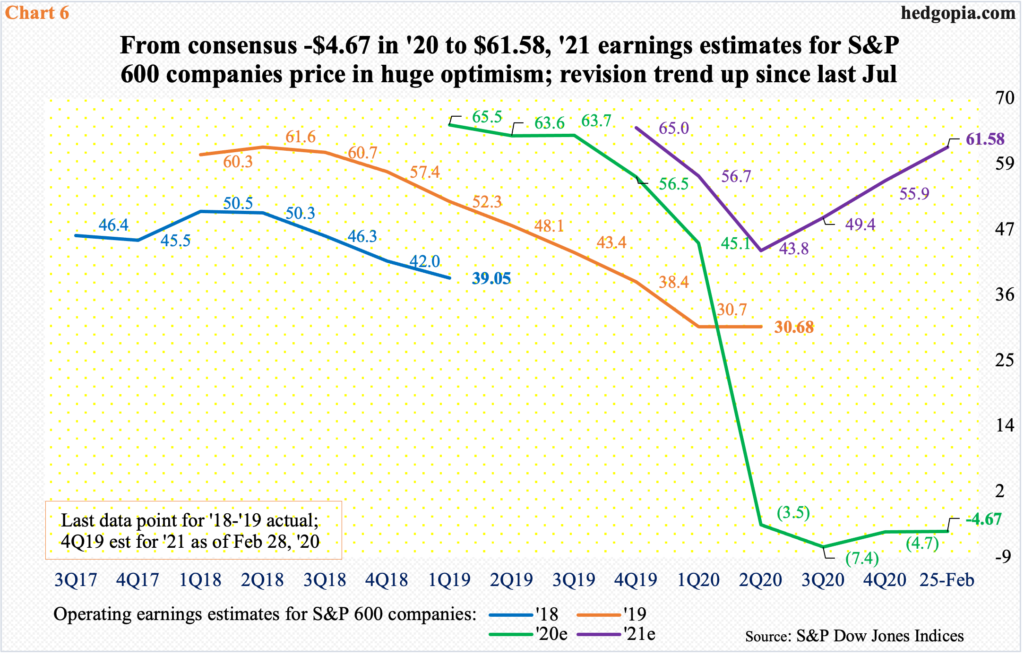
Growth expectations are very high. As are earnings estimates. S&P 500 companies are expected to earn $171.21 this year, up from $118.53 last year. For S&P 500 400 companies, estimates are $120.82 and $74.23 respectively and for S&P 600 companies $61.58 and minus $4.67.
If earnings come in anywhere close, it is no rocket science, markets will begin to demand higher rates on the short end, forcing the Fed’s hands. Currently, they do not expect this. Neither does the Fed. So, it will be a curveball.
If growth falls short of expectations, then it is a no-brainer. Just imagine how small-caps will fare in this scenario. As mentioned previously, S&P 600 earnings are expected to do a massive U-turn – from a small loss last year to a big gain (Chart 6). Small-cap companies inherently have more domestic exposure than their large-cap peers and have priced in massive improvement in both the economy and earnings.
A bigger worry relates to stimulus-induced growth. Even before the current $1.9-trillion stimulus package goes through, households were already sitting on tons of cash, thanks to the previous stimulus efforts. Then what?
Of note, debt has gone through the roof. Last year alone, federal debt surged $4.5 trillion, with the latest count of $28 trillion – and counting. Similarly, in the first three quarters last year, non-financial corporate debt was up $856.7 billion to $10.9 trillion, while household debt rose $404.9 billion to $16.4 trillion.
As leveraged as the economy is, higher interest rates borne out of sustained economic growth will eventually cause higher interest payments, which can then act as automatic brakes on economic activity. A catch-22.
Last March when stocks were selling off hard, the Fed announced unlimited QE and also said it would start buying investment-grade corporate bonds, which was then expanded in April to also include high-yield bonds. The Fed was essentially urging investors to take on risk and move up the risk curve. The latter has obliged. Margin debt is just an example.
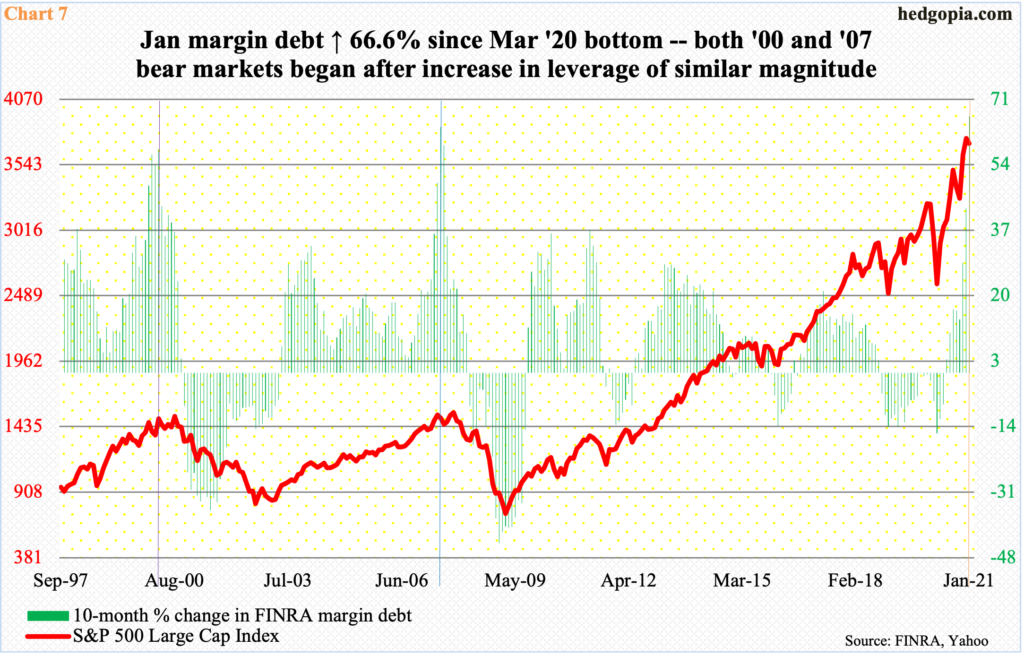
FINRA margin debt was up $20.6 billion month-over-month in January to $798.6 billion – a new record. Since last March, it has gone up $319.3 billion, or 66.6 percent. Investors have heeded the Fed’s call for risk-taking. But trees do not grow to the sky. Gravity always rules. Unwinding of this leverage is just a matter of time.
In this regard, the 10-month increase of 66.6 percent in January was a record itself. Previous records were 57.9 percent in March 2000 and 63.8 percent in June 2007. In 2000, the S&P 500 peaked in March and in 2007 in October, before bear markets began (Chart 7).
Hence the potential significance of how January and February behaved technically. Bulls can still regroup and stop more damage, but the first two months have also provided an opening for the bears. March is setting up to be an interesting month.
Thanks for reading!


