
The year is still young but so far there’s a clear winner in the horse race among US equity factors: momentum. Following a mostly meandering performance in 2019’s fourth quarter, large-cap momentum has been on a nearly non-stop rally in the new year that’s left the rest of the field in the dust, based on a set of ETFs representing factor strategies in the US equity market.
The iShares Edge MSCI USA Momentum Factor (MTUM) climbed 5.2% year to date through yesterday’s close (Jan. 21). The gain is well ahead of the second-best factor performer–iShares S&P 500 Growth (IVW), which is up 4.7% so far this year. MTUM’s performance edge widens further vs. the remaining factor funds on our list.

Some market observers argue that a shift away from momentum is unfolding. A JP Morgan analyst, for instance, last week advised that investors are rotating out of momentum into value stocks. Perhaps investment flows tell the story, but at the moment there’s little evidence of the transition to value in the year-to-date returns for our set of proxy ETFs.
Indeed, the large-cap value factor–based on iShares S&P 500 Value (IVE) – is currently up a slight 0.9% so far in 2020. Mid- and small-cap value funds are posting even softer results, including the only year-to-date decline in the factor space at the moment: iShares S&P Small-Cap 600 Value (IJS), which has slipped 0.7%.
For comparison, the US stock market overall is up a strong 2.9% so far in 2020, based on SPDR S&P 500 ETF (SPY).

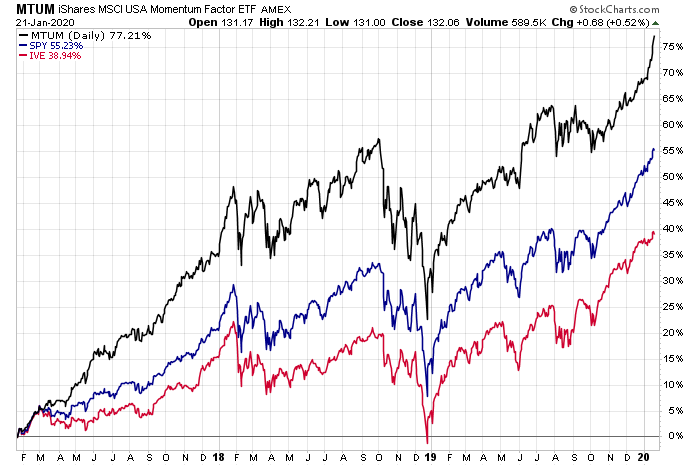
The impressive run in momentum stocks worries some analysts, who argue that this factor strategy has run too far too fast in recent years. Indeed, compared with the broad market (SPY), MTUM has outperformed by a wide margin over the past three years, rising more than 77% vs. SPY’s 55% advance. Large-cap value stocks, on the other hand, have trailed the market and momentum by a wide margin over that span, advancing by a comparatively moderate 39%.
The lagging performance in value convinces some investors that a buying opportunity exists in portfolios of value stocks while momentum appears due for a correction. Maybe, but MTUM’s rally has barely flinched this year as the ETF rose for a fourth straight day on Tuesday, closing at a record high.
Meanwhile, profiling all the ETFs listed above through a momentum lens suggests that an upside bias prevails, even for the lone year-to-date loser: small-cap value (IJS). The analysis is based on two sets of moving averages. The first compares the 10-day moving average with its 100-day counterpart — a proxy for short-term trending behavior (red line in chart below). A second set of moving averages (50 and 200 days) represent the intermediate measure of the trend (blue line). Based on data through Jan. 21, all the factor ETFs on our list are posting upside momentum profiles.


Comments
Log in or sign up to join the conversation.