
Mixed Messages
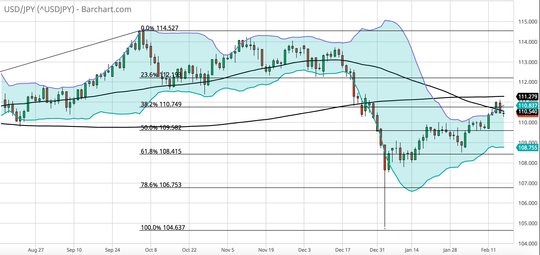
We all know the problem, without a traffic light, rules about who goes first become a game of chicken. There are mixed signals and mixed messages in our driving markets today. Hope on better trade deals, hope for more easy money meet the reality of deflationary risks. The downdraft in risk in Asia reverses in Europe. There are mixed messages in the data and the headlines. Markets are preparing for more US data as well after the weaker US retail sales left many rethinking the Goldilocks story for markets. Growth steady and inflation tame is not what the tape is providing. China is a case in point. The largest increase in new bank loans in China on record, and a larger than expected drop in CPI and PPI don’t mix well. Next week the retail sales, industrial production and unemployment will be watched against the large rise in money supply to make clear whether Beijing has done enough. Many are trying to dissect the China seasonal noise of the new-year and the usual front-loading of lending in January against the government efforts to stoke up the economy. The real driver of the mood overnight is more about the fate of the US/China trade talks – where President Xi stepped in and where Mnuchin noted they were “productive” suggesting that there is still hope for a deal and delay mixture in the month ahead. The other headlines from Asia – weaker Singapore 4Q GDP on the revision, weak Japan industrial production confirmed, and lower NZ PMI – all led to the risk-off swing. The flip in Europe rests on trade talk hopes, better UK retail sales, and a view that even with auto sales weaker, Germany is over the worst of its slowdown. Whether this is true will depend on the data ahead and for that we must wait. The mixed market messages make clear that the JPY is the safe-haven to watch today as the failure over 111 opens 110 and lower should the US not continue the fragile hopes for more US trade deals and stable US government. Trump speaks at 10 to likely enact emergency measures for the wall.
Question for the Day: Does the China money supply offset the PPI? The connection between easy money and asset prices works everywhere but with some lag as confidence from the action into the real economy – i.e. forward guidance – matters as well. The US and EU versions of low rates and QE drove up bonds, equities and home prices from 2009 – with the role of the banks critical. The China version of such easy money and QE hasn’t yet been felt. Perpetual bonds are just starting, while the PBOC has delivered 4 RRR cuts, rates are still over 2% - making real rates positive still. The leap up in the January total social finance merits watching. The connection of M2 or CNY Bank loans to China home loans isn’t so obvious.
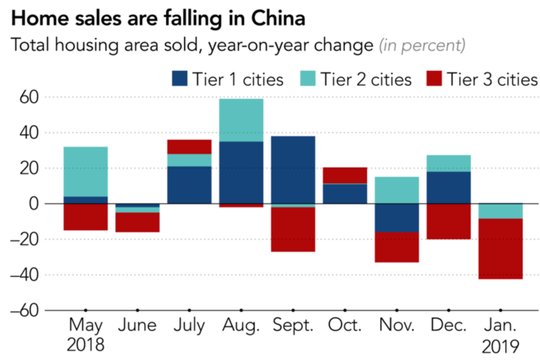
The Nikkei Asian Review reports that 65mn urban residences (21.4% of all housing) is unoccupied, that is up from 18.4% in 2011. Sales volumes in 24 cities tracked by China Real Estate Index System fell by 44% in the first week of 2019 compared with a year earlier, though the four largest cities -- Shanghai, Shenzhen, Guangzhou, and Beijing -- still saw a 12% increase. Many analysts now expect China's home sales to contract this year. Perhaps more worrisome, though, is the growing number of Chinese property companies that appear to be struggling under the weight of heavy debt burdens. Moody's Investors Service has assigned junk status to 51 of the 61 Chinese property companies it assesses.
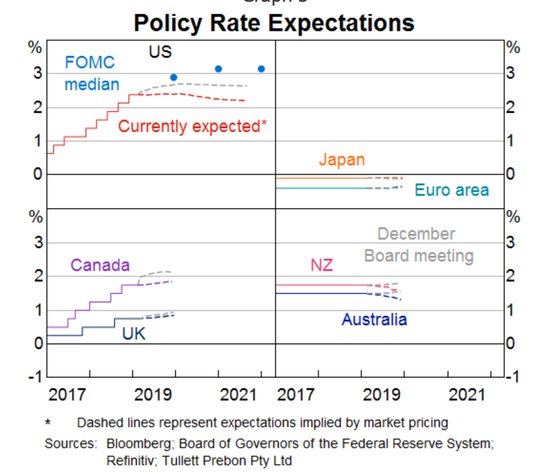
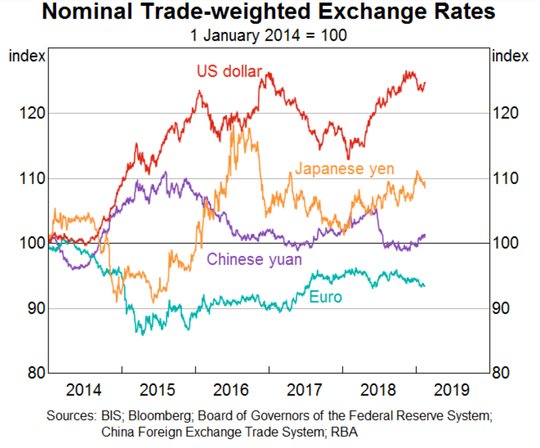
The turnabout in global policy since January outside of China also matters and supports the more traditional push of exports for growth. The RBA chart on policy outlooks is worth considering on this point as is the chart on real trade weighted FX. Perhaps the key for better China growth is going to be a mix of more easy money and a weaker CNY.
What Happened?
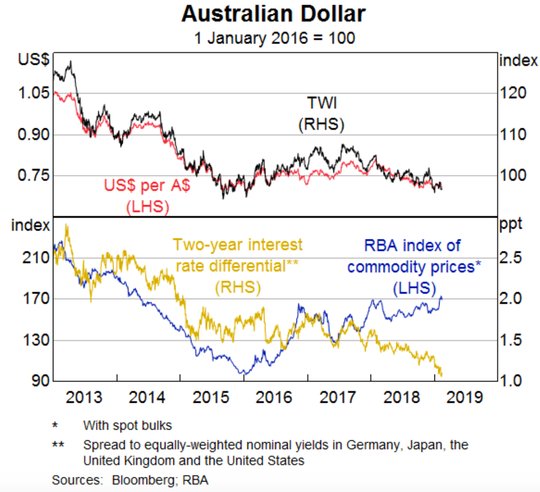
- RBA Kent: A$ weakness “helpful at the margin.” In a broad ranging speech on FX, global and local economics and on policy, the assistant Governor spoke about financial conditions, noting that the A$ has fallen a little in recent months but that it remains in a relatively narrow range over the last 2 years.
- New Zealand January BusinessNZ manufacturing PMI drops to 53.1 from 55.1 – below 53.4 long-term average. New orders fell to 52.2 – back to Dec 2017 lows.
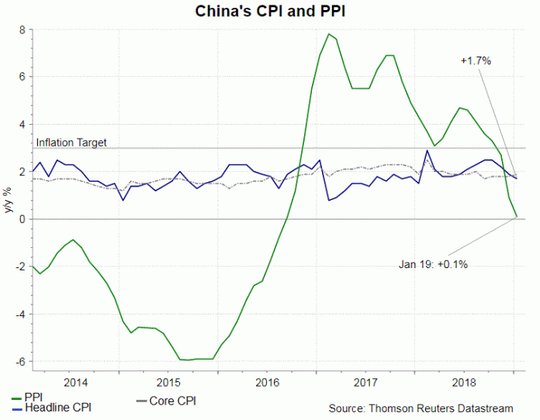
- China January CPI up 0.5% m/m, 1.7% y/y after 0% m/m, 1.9% y/y – less than the 1.9% y/y expected – lowest since Jan 2018. The food price index rose 1.9% from 2.5% y/y. Core prices (ex food and energy) rose 1.9% y/y from 1.8% y/y.
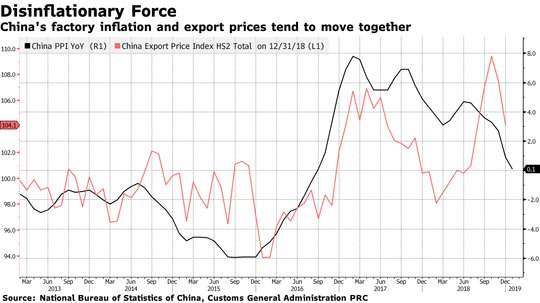
- China January PPI up -0.6% m/m, +0.1% y/y after -1% m/m, +0.9% y/y – less than 0.4% y/y expected – slowest since Sep 2016. The prices of means of production entered the negative zone, edging down 0.1% y/y, according to the NBS. Of major industrial sectors, the PPI in oil and natural gas exploration dipped 5%, compared with an increase in December. The PPI for non-ferrous metal smelting and rolling declined 3.5% after the 2.3% fall recorded in December.
- China January M2 up 8.4% after 8.1% - more than the 8.2% expected. The new CNY loans rise CNY3.23trn after CNY1.08trn – more than the CNY2.8trn expected – a new record. The total social finance rose CNY4.64trn from CNY1.59trn – also more than the CNY3.25trn expected. Overall loan growth slows to 13.4% y/y from 13.5% y/y – still more than the 13.1% y/y expected. Corporate loans jumped to 2.58 trillion yuan from 473.3 billion yuan in December, while household loans rose to 989.8 billion yuan from 450.4 billion yuan. Corporate loans accounted for 80 percent of new loans in January, up sharply from 44 percent in December.
- Japan December final industrial production confirmed at -0.1% m/m, -1.9% y/y after -1% m/m, +1.5% y/y – as expected.
- Spain January final CPI -1.3% m/m, +1% y/y after -0.4% m/m, 1.2% y/y - as expected. The HICP -1.7% m/m, +1.0% y/y after 1.2% y/y – also as expected.
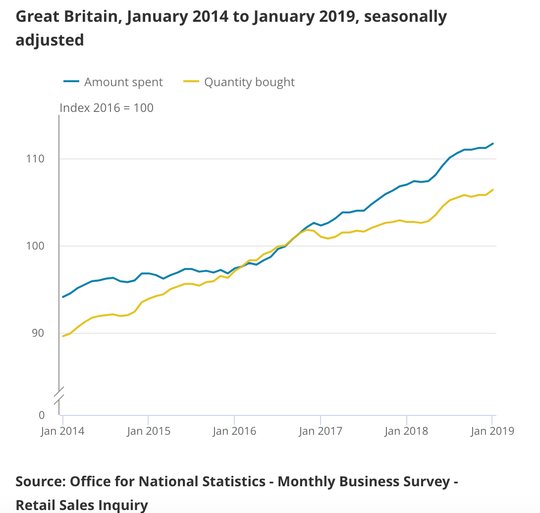
- UK January retail sales +1% m/m, 4.2% y/y after revised -0.7% m/m, 3.1% y/y – better than the +0.2% m/m, 3.4% y/y expected. December revised stronger from -0.9% m/m. The ex-fuel sales rose 1.2% m/m, 4.1% y/y after -1.0% m/m, 2.9% y/y – also more than the +0.2% m/m,) 3.0% y/y expected. The quantity bought in textile, clothing and footwear stores showed strong year-on-year growth at 5.5% as stores took advantage of the January sales, with a year-on-year price fall of 0.9%.
Market Recap:
Equities: The US S&P 500 futures are up 0.1% after losing 0.27% yesterday – US futures flipped from offered to bid in Europe. The Stoxx Europe 600 is up 0.8% on trade story hopes, better UK data. MSCI Asia Pacific fell 1.2% with US/China trade talk doubts and mixed China data.
- Japan Nikkei off 1.13% to 20,900.63
- Korea Kosp off 1.34% to 2,196.09i
- Hong Kong Hang Seng off 1.87% to 27,900.84
- China Shanghai Composite off 1.37% to 2,682.39
- Australia ASX up 0.15% to 6,148.60
- India NSE50 off 0.20% to 10,724.40
- UK FTSE so far up 0.45% to 7,228
- German DAX so far up 0.8% to 11,176
- French CAC40 so far up 1.0% to 5,114
- Italian FTSE so far up 0.5% to 19,929
Fixed Income: The risk off push in Asia and the turn about in Europe isn’t much of the story for bonds as its more focused on politics in Spain and Italy with periphery driving – German 10Y Bund yields flat at 0.1%. France up 1bps to 0.54% and UK Gilts flat at 1.15% while Italy up 9bps to 2.89%, Spain up 1bps to 1.25%, Portugal flat at 1.59% and Greece off 1bps to 3.85%
- US Bonds bid holding gains from yesterday – 2Y flat at 2.51%, 5Y off 1bps to 2.48%, 10Y off 1bps to 2.66%, 30Y off 1bps to 2.99%.
- Japan JGBs rally with curve flatter on weaker equities – 2Y flat at -017%, 5Y flat at -0.16%, 10Y off 1bps to -0.02% and 30Y off 3bps to 0.63%.
- Australian bonds rally with US moves – 3Y off 2bps to 1.68%, 10Y off 3bps to 2.12%.
- China bonds reverse big rally on M2 – 2Y off 1bps to 2.62%k 5Y flat at 2.87%k 10Y off 1bps to 3.09%. PBOC skips open market operations for 5th day.
Foreign Exchange: The US dollar index is up 0.1% to 97.08 In EM - $ is mixed - RUB off 0.1% to 66.719, ZAR up 0.2% to 14.102, INR off 0.35% to 71.268, KRW off 0.2% to 1127.55
- EUR: 1.1280 off 0.15%. Range 1.1268-1.1297 with focus on 1.1250-1.1300 on the narrow and bias for 1.1215 and lower.
- JPY: 110.45 flat. Range 110.25-110.55 with EUR.JPY 1.24.55 off 0.25% - equities and risk mood driving with US retail sales adding to fear. 110 key
- GBP: 1.2825 up 0.2%. Range 1.2785-1.2832 with EURGBP off 0.35% to .8795. Retail sales offset the usual gloom about Brexit with 1.2750-1.2900 the new keys.
- AUD: .7115 up 0.15%. Range .7079-.7116 with commodities driving post China m2 and with focus on RBA still .7050 key. NZD up 0.3% to .6855 with .6920 still important.
- CAD: 1.3285 off 0.1%. Range 1.3278-1.3313 with data today driving 1.32 or 1.34.
- CHF: 1.0060 up 0.1%. Range 1.0046-1.0069. EURCHF off 0.05% to 1.1345
- CNY: 6.7700 flat. Range 6.7660-6.7810. PPI vs M2 driving PBOC fixed stronger at 6.7623 from 6.7744
Commodities: Oil up, Gold up, Copper up 1.1% to $2.8155
- Oil: $54.85 up 0.8%. Range $54.62-$55.39 with focus on US/China, USD and $55 pivot in WTI. Brent up 0.3% to $64.78 with $65 similar pivot.
- Gold: $1322 up 0.6%. Range $1314.30-$1322.50. Market is watching USD again and focused on $1305 base holding for $1340 run. Silver up 0.9% to $15.67. Platinum up 0.4% to $792.90 and Palladium up 1.1% to $1401.30.
Economic Calendar:
- 0830 am Canada Jan ADP employment change -13k p -3k e
- 0830 am US Jan export prices (m/m) -0.6%p -0.1%e / import prices -1%p -0.1%e
- 0830 am US Feb NY Empire Fed manufacturing 3.9p 7e
- 0915 am US Jan industrial production (m/m) 0.3%p 0.1%e / manufacturing 1.1%p 0.4%e
- 0955 am Atlanta Fed Bostic Speech
- 1000 am US Feb preliminary Univ. Michigan consumer sentiment 91.2p 94.5e
- 0400 pm US Dec Long-Term TIC flows
View TrackResearch.com, the global marketplace for stock, commodity and macro ideas here.


