
Mixed Housing Data
On the same day that mortgage applications plunged 12% and one day after homebuilder sentiment for the month of May showed a large decline, the latest updates on Housing Starts and Building Permits showed a mixed picture. While economists were expecting both reports to decline, the drop in Housing Starts was more than expected while the decline in Building Permits was slightly less than forecast.
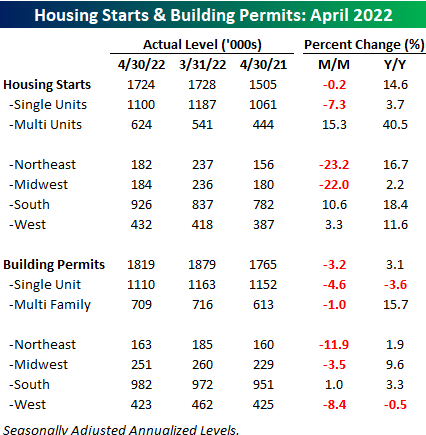
The table below breaks down this month’s report by type of unit and region and shows both the m/m and y/y changes. For Housing Starts, the 0.2% m/m decline was driven entirely by single-family units (-7.3%) while multi-family units surged 15.3%. With respect to Building Permits, we saw a similar breakdown although the disparity wasn’t nearly as large as single-family units dropped 4.6% while multi-family units declined just 1%. On a regional basis, the Northeast and Midwest experienced 20%+ declines on a m/m basis while every region except the South experienced declines in Building Permits.
While both Housing Starts and Building Permits declined on a m/m basis, the longer-term trend for both still remains intact. At 1.759 million, the 12-month average of Building Permits came in at the highest level since January 2007 while the 1.659 million average level of Building Permits was the highest since February 2007. Higher interest rates have caused a slowdown in housing at the margin, but longer-term trends have yet to show signs of rolling over.

Click here to learn more about Bespoke’s premium stock market research ...
more

