Middle-Class Wages In August 2021
We've updated this series to include the July release of the Consumer Price Index as the deflator and the monthly employment update. The latest hypothetical real (inflation-adjusted) annual earnings are at $44,443, down 6.5% from 45-plus years ago.
The Bureau of Labor Statistics has been collecting data on this workforce cohort since 1964. The government numbers provide some excellent insights on the income history of what we might think of as the private middle-class wage earner.
The first snapshot shows the growth of average hourly earnings. The nominal data exhibits a relatively smooth upward trend. The COVID-19 pandemic caused a temporary rise in earnings likely due to demand for temporary work.

There are, however, two critical pieces of information that dramatically alter the nominal series: The average hours per week and inflation.
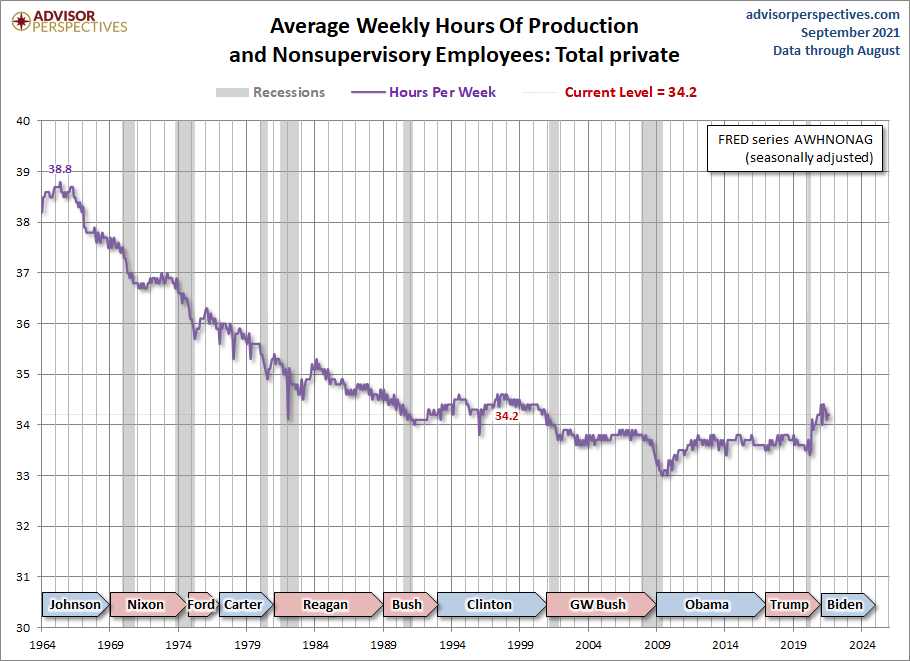
The average hours per week has trended in quite a different direction, from around 39 hours per week in the mid-1960s to a low of 33 hours at the end of the last recession (2008). Currently, amid the COVID-19 crisis, weekly hours are at 34.2 which is a 72-minute increase since its lowest-ever levels, and 4 hours and 36 minutes a week below the high in the mid-60s.
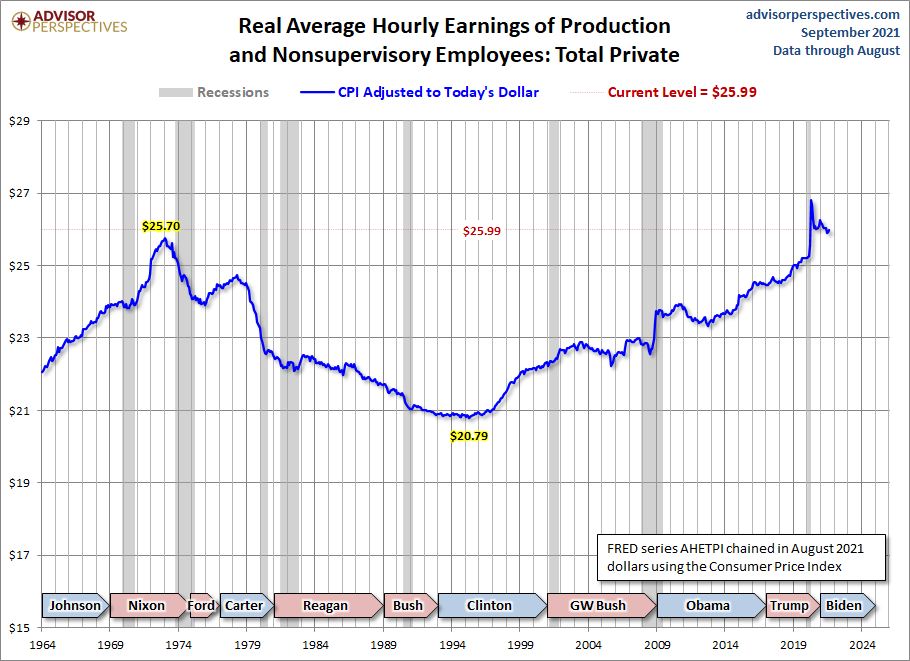
What about inflation? The next chart adjusts hourly earnings to the purchasing power of today's dollar. We've used the familiar Consumer Price Index for Urban Consumers (usually abbreviated as the CPI) for the adjustment with a linear extrapolation for the latest month. Theoretically, the CPI is designed to reflect the cost-of-living for metropolitan-area households. We use a linear extrapolation to compute the latest monthly inflation data until the mid-month release of the official CPI data.
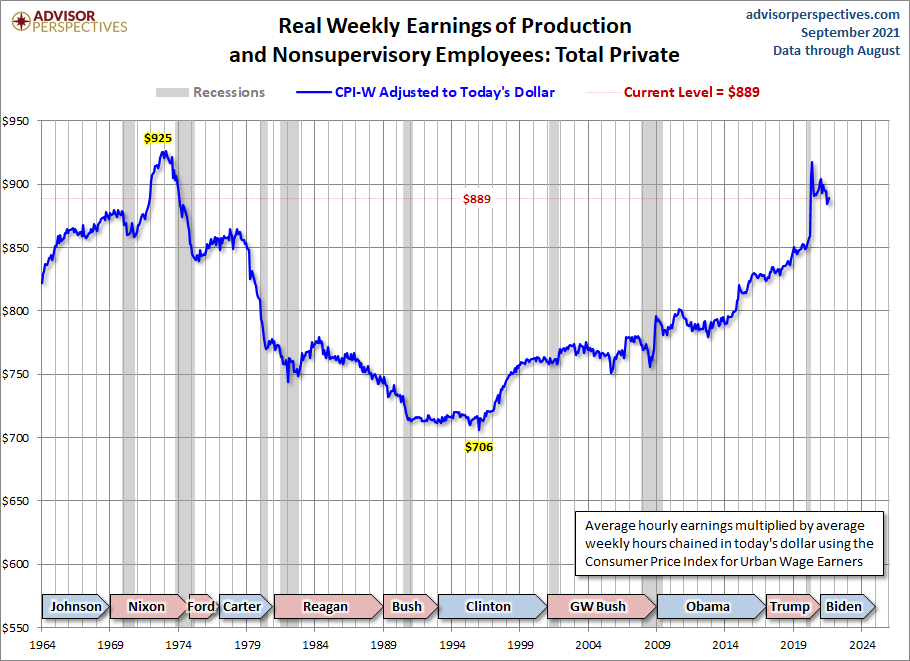
Now let's multiply the real average hourly earnings by the average hours per week. We thus get a figure for average weekly earnings of this middle-class cohort, currently at $889 — below its $891 peak back in the early 1970s.

Note that this is a gross income number that doesn't include any tax withholding or other deductions. Disposable income would be noticeably lower.
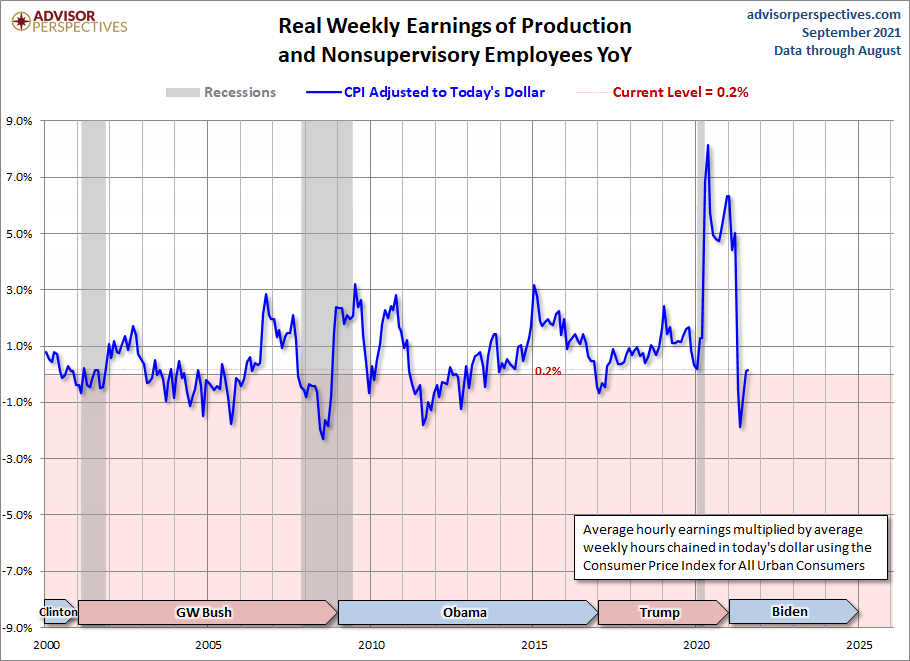
Here's a look at the YoY comparison for the last twenty years.
Latest Hypothetical Annual Earnings: $44,443, Down 6.5% from 49 Years Ago
If we multiply the hypothetical weekly earnings by 50, we get an annual figure of $44,443. That's a 6.5% decline from the similarly calculated real peak in October 1972. In the charts above, we've highlighted the presidencies during this timeframe. Our purpose is not necessarily to suggest political responsibility, but rather to offer some food for thought. We will point out that the so-called supply-side economics popularized during the Reagan administration (aka "trickle-down" economics), wasn't very friendly to production and nonsupervisory employees.
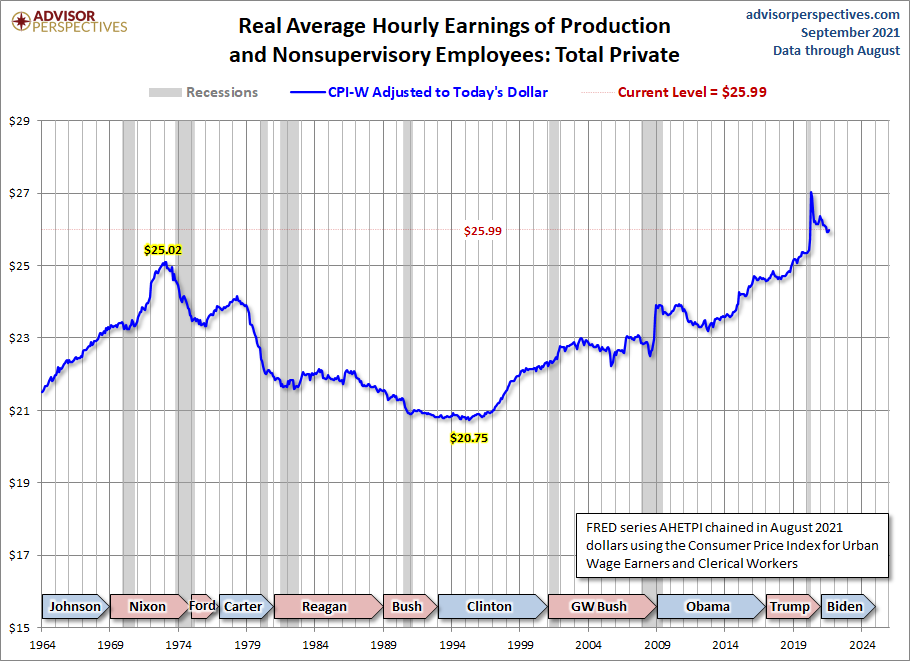
Footnote: Here is a slightly different look at the data. We've adjusted using the less familiar Consumer Price Index for Urban Wage Earners and Clerical Workers, the CPI-W, which is theoretically a better match for the production and nonsupervisory cohort. The index, among other things, assigns a slightly higher weighting for gasoline (e.g., longer drives to work and the grocery store). Also, this is the series the government uses to calculate the Social Security Cost of Living Adjustments (COLAs).
Here is the real hourly history with this deflator.
Here is the real hourly data multiplied by the average weekly hours. The latest data point is 4.0% below the 1972 peak.