
Mid Cap Best & Worst Report - June 8, 2016
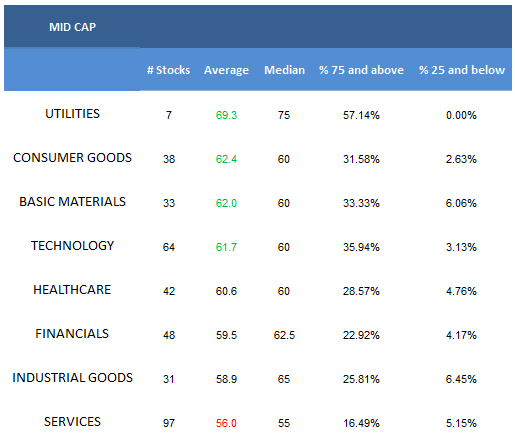
- The best mid cap sectors are utilities and consumer goods.
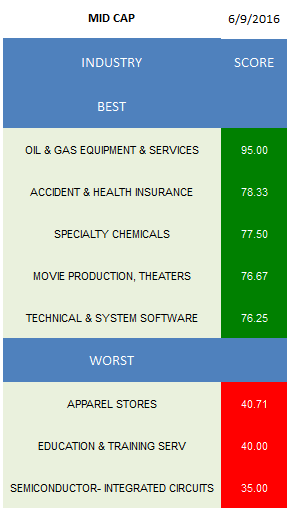
- The highest scoring mid cap is oil & gas equipment & services.
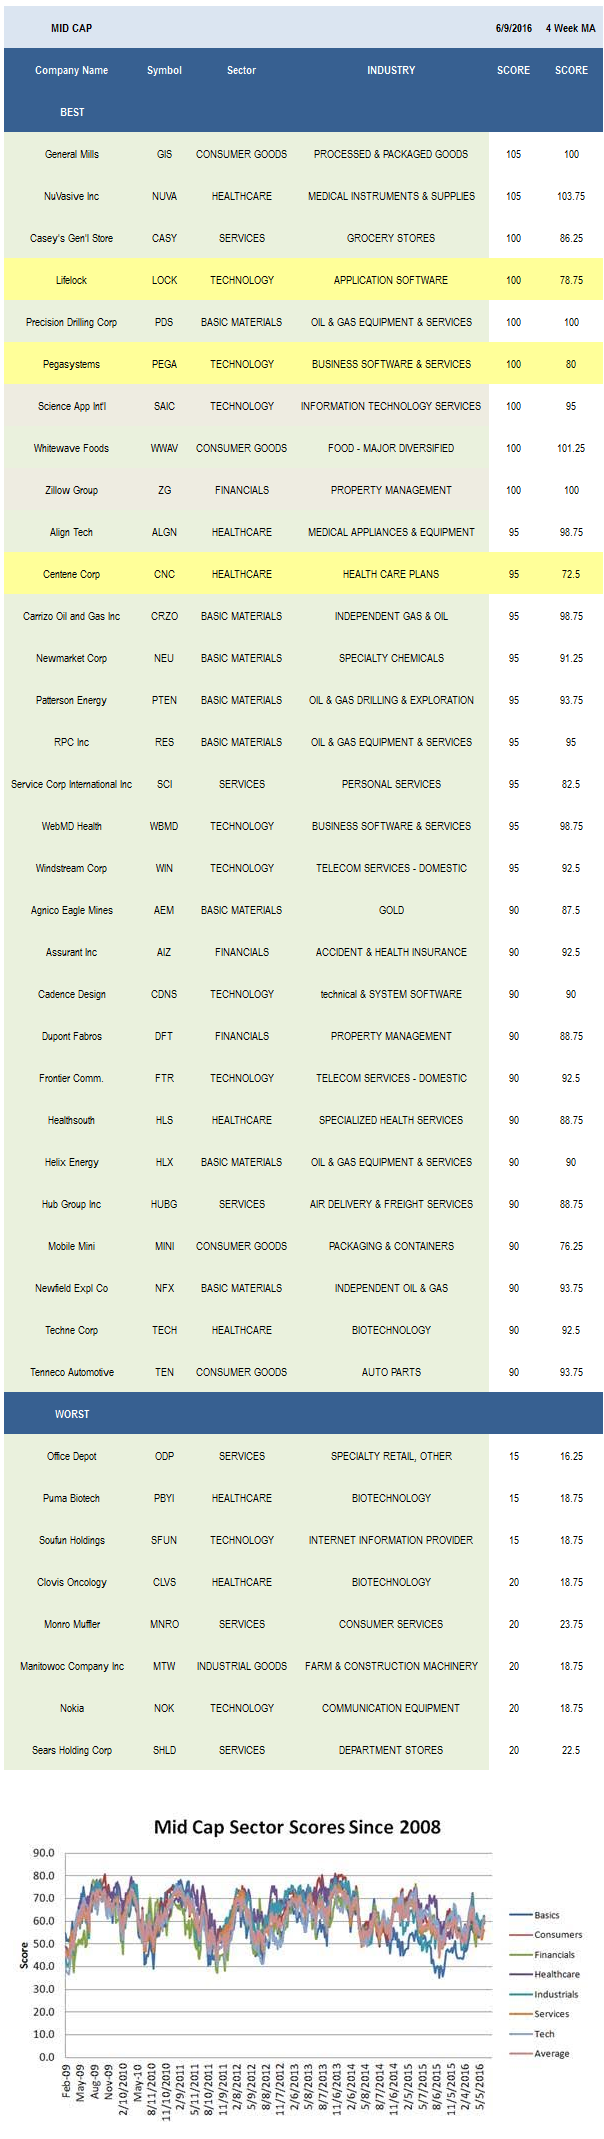
The average mid cap score is 59.76 and the average four week moving average score is 57.62. The average mid cap stock in our coverage is trading -19.78% below its 52 week high, 5.95% above its 200 dma, has 6.49 days to cover held short, and is expected to grow its EPS by 16.3% in the coming year.
The strongest mid cap sector is utilities -- normal for this time of year.Consumer goods, basics, and technology also score high. Healthcare, financials, and industrials score in line. Services score below average. Historically, services offer a better entry point later in the summer/early fall.
The best mid cap industry is oil & gas equipment & services (PDS, RES, HLX). Accident & health insurance (AIZ, CNO), specialty chemicals (NEU), movies (RGC, DWA, CNK), and technical & system software (CDNS, TYL, MENT) also score strong.
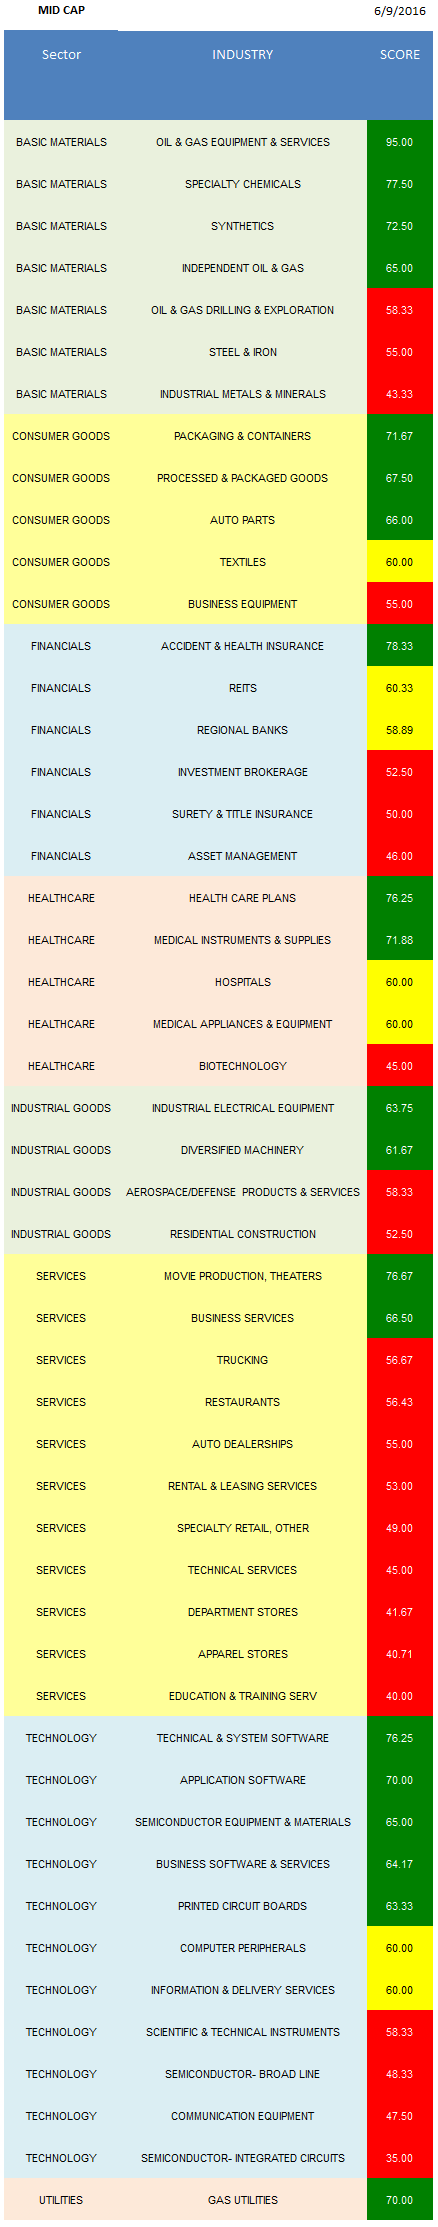
The best basic materials baskets are oil & gas equipment & services, specialty chemicals, and synthetics (POL). In consumer goods, buy packaging & containers (MINI, TUP), processed & packaged goods (GIS), and auto parts (TEN, FDML). Accident & health insurance is the only industry to score above average in mid cap financials. Healthcare plans (CNC, WCG) and medical instruments (NUVA, TFX, PKI, HRC) are top scoring in healthcare. Industrial electrical equipment (BDC, AOS) and diversified machinery (ATU, MIDD) can be bought in industrials. In services, focus on movies and business services (RBA, GPN, HMSY). The best technology industries to own in portfolios are technical & system software, application software (LOCK, MANH), and semi equipment & materials (ENTG). Gas utilities (NJR, EGN) can also be owned.
Disclosure: None.


