Michigan Consumer Sentiment Lowest Reading On Record
The June Final Report came in at 50.0, down 8.4 (14.4%) from the May Final. Investing.com had forecast 50.2. Since its beginning in 1978, consumer sentiment is 41.7 percent below the average reading (arithmetic mean) and 41.0 percent below the geometric mean.
Surveys of Consumers chief economist, Richard Curtin, makes the following comments:
The final June reading confirmed the early-June decline in consumer sentiment, settling 0.2 Index points below the preliminary reading and 14.4% below May for the lowest reading on record. Consumers across income, age, education, geographic region, political affiliation, stockholding and homeownership status all posted large declines. About 79% of consumers expected bad times in the year ahead for business conditions, the highest since 2009. Inflation continued to be of paramount concern to consumers; 47% of consumers blamed inflation for eroding their living standards, just one point shy of the all-time high last reached during the Great Recession. Since the preliminary reading, the Federal Reserve raised interest rates by 75 basis points, exceeding the 50 basis point hike that had been previously telegraphed. The final June reading of the median expected year-ahead inflation rate was 5.3%, little changed from mid-month or the preceding four months. In contrast, long run expectations receded from its mid-month reading of 3.3% and settled at 3.1%, back within the 2.9-3.1% range seen in the past 10 months. Consumers also expressed the highest level of uncertainty over long-run inflation since 1991, continuing a sharp increase that began in 2021. [More...]
See the chart below for a long-term perspective on this widely watched indicator. Recessions and real GDP are included to help us evaluate the correlation between the Michigan Consumer Sentiment Index and the broader economy.

To put today's report into the larger historical context since its beginning in 1978, consumer sentiment is 41.7 percent below the average reading (arithmetic mean) and 41 percent below the geometric mean. The current index level is at the null percentile of the 534 monthly data points in this series.
Note that this indicator is somewhat volatile, with a 3.0 point absolute average monthly change. The latest data point saw a 8.4 point decrease from the previous month. For a visual sense of the volatility, here is a chart with the monthly data and a three-month moving average.

For the sake of comparison, here is a chart of the Conference Board's Consumer Confidence Index (monthly update here). The Conference Board Index is the more volatile of the two, but the broad pattern and general trends have been remarkably similar to the Michigan Index.

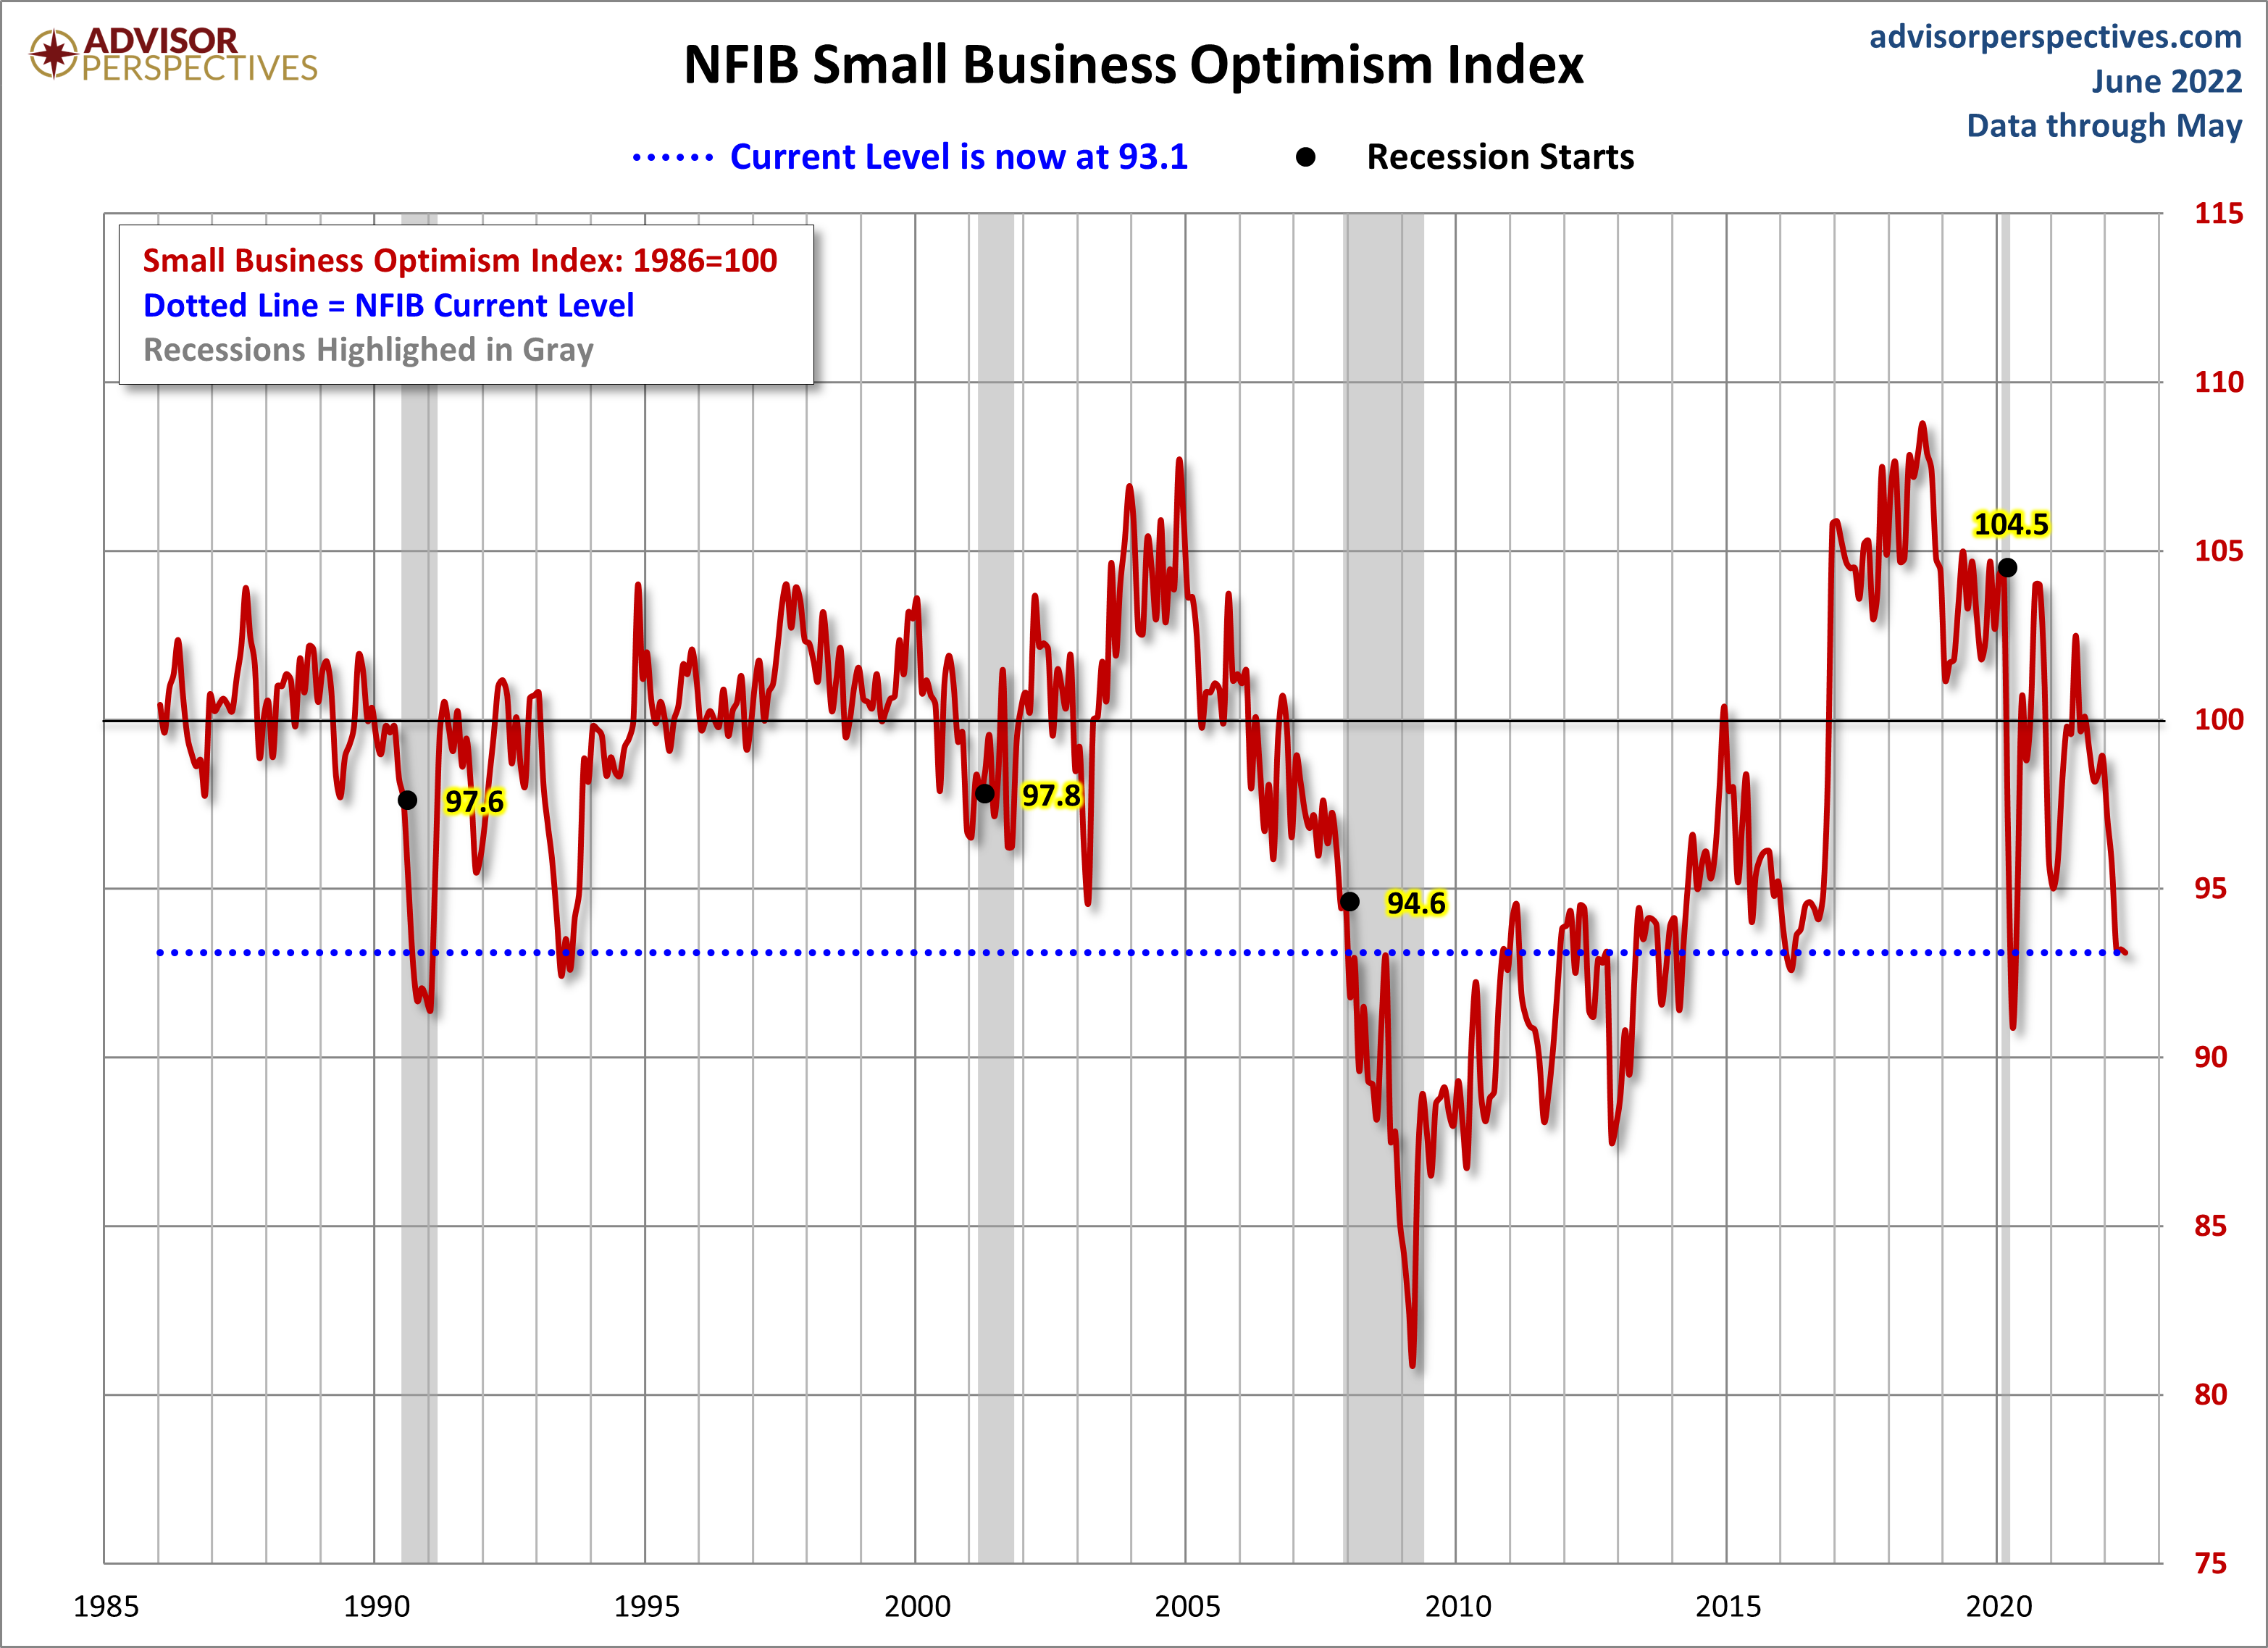
And finally, the prevailing mood of the Michigan survey is also similar to the mood of small business owners, as captured by the NFIB Business Optimism Index (monthly update here).