
Mexican Peso Price Forecast: USD/MXN Above 20.00 As Bulls Break Out
Last week saw USD/MXN test down to a fresh nine-month-low, continuing a trend that’s been in-place since last March. And given the prevailing market forces coming into the year, where USD-weakness has been front-and-center in response to the FOMC response to the pandemic – there was wide expectation that this weakness would continue. But, so far in 2021, that statement has to be put on hold as USD/MXN bears haven’t been able to do much below the key psychological value of 20.00.
The tenuous drive from short-sellers helped the pair to build in to a falling wedge pattern, marked by two converging trendlines of varying slope. Resistance holds a more aggressive slope as bears have remained aggressive upon tests of lower-highs, but support shows a weaker slope or angle as sellers slow upon tests of fresh lows. Such formations will often be approached with the aim of bullish breakouts, looking for reversal to take-hold following that tenuous drive in the direction of the prior trend.
USD/MXN FOUR-HOUR PRICE CHART
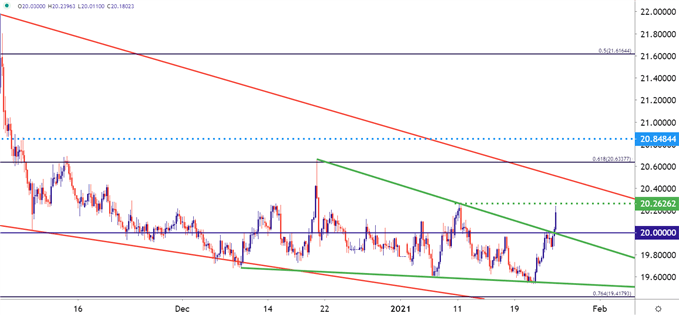
Chart prepared by James Stanley; USDMXN on Tradingview
Taking a step back on the chart, and this short-term falling wedge takes places inside of a longer-term falling wedge. And, again, both formations point to the possibility of bullish reversals albeit with varying timelines.
This also further denotes the possibility of a prolonged short-squeeze scenario after sellers drove price action for much of the time since the March flare. On a near-term basis, traders can follow the current breakout from the shorter-term formation, looking for tests of longer-term resistance to gauge the possible staying power of the bullish move.
The 2021 swing-high is now very nearby at 20.2626, and beyond that is the current two-month-high at a longer-term Fibonacci level of 20.6338. If price action is able to test that level – then we’d have a break of the longer-term falling wedge pattern, and the next area of possible resistance would be derived from a batch of prior swing lows taken from October and November of last year around 20.8484.
USD/MXN DAILY PRICE CHART
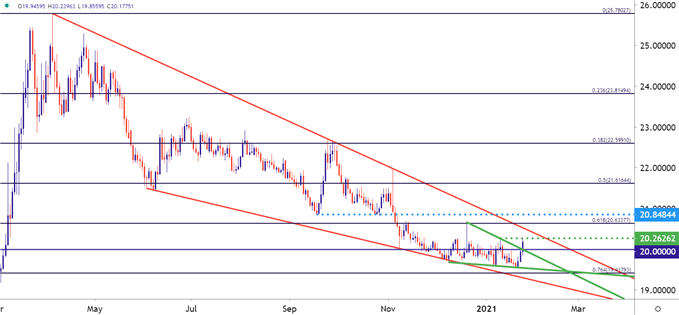
Chart prepared by James Stanley; USDMXN on Tradingview
Disclosure: See the full disclosure for DailyFX here.


