
Mexican Peso Forecast: USD/MXN Rates Break Critical Support Region - Key Levels
MEXICAN PESO WIN STREAK CONTINUES POST-US ELECTIONS
The Mexican Peso has had a strong November thus far, particularly in the wake of the US presidential election. The prospects for reduced trade tensions with Mexico’s largest trading partner, the United States, coupled with expectations for a continued accommodative US policy outlook, has attracted speculative capital to the Mexican Peso. USD/MXN rates are on pace for their second-worst month of 2020, and only the fifth time in the past five years that USD/MXN rates have lost more than -5% on a monthly basis.
MEXICAN PESO FOREX ECONOMIC CALENDAR - REST OF WEEK
The Thanksgiving holiday in the United States upends financial markets, creating illiquid trading conditions and a thinner economic calendar. That said, there are still a few data releases over the coming days that could introduce volatility to USD/MXN rates in otherwise thin markets – treacherous conditions for new traders given the prospect for sharp price swings. Thursday’s final Q3’20 Mexican GDP release and Banxico’s monetary policy meeting minutes could easily provoke sizeable moves in an otherwise quiet market.
USD/MXN RATE TECHNICAL ANALYSIS: DAILY CHART (NOVEMBER 2019 TO NOVEMBER 2020) (CHART 1)
(Click on image to enlarge)
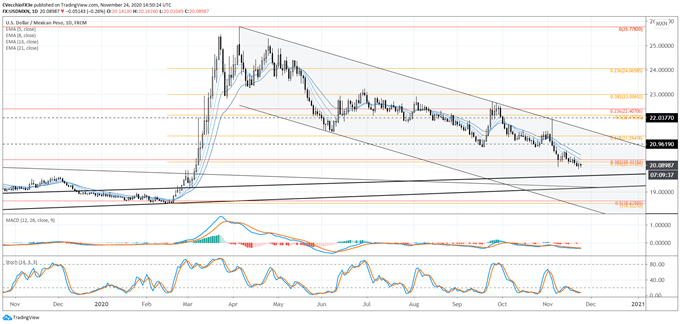
USD/MXN rates remain in the parallel downtrend dating back to the coronavirus pandemic high set in April. The downtrend is robust, with three clear points of resistance in April, September, and November – in fact, the November touch of resistance came on the day of the US election. Since the November resistance test, which came in the form of a bearish outside engulfing candle, USD/MXN rates have been biased lower.
Bearish momentum has accelerated, with USD/MXN rates below their daily 5-, 8-, 13-, and 21-EMA, which is in bearish sequential order. Daily MACD is trending lower below its signal line, while Slow Stochastics are nestled in oversold territory. In recent days, two significant Fibonacci retracement levels serving as critical support have broken: the 76.4% retracement of the 2020 low/high range at 20.2349; and the 38.2% retracement of the past 10-years of trading low/high range (April 2011 low/April 2020 high) at 20.3215.
USD/MXN RATE TECHNICAL ANALYSIS: WEEKLY CHART (JANUARY 2014 TO NOVEMBER 2020) (CHART 2)
(Click on image to enlarge)
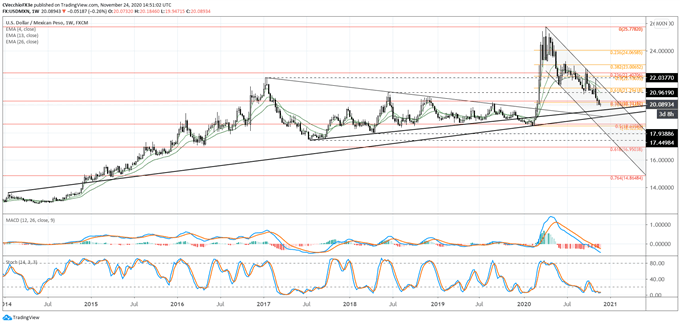
Our weekly view remains consistent. “The continued pullback from the March 2020 high suggests that the triangle breakout experienced in Q1’20 may ultimately yield to a return to the triangle. To this end, momentum on the weekly timeframe remains firmly bearish, more so than on the daily timeframe.
"USD/MXN rates are below their weekly 4-, 13-, and 26-EMA envelope. Weekly MACD is trending lower below its signal line, while Slow Stochastics are nestled in oversold territory. A pullback towards symmetrical triangle support near 19.7300 over the coming weeks cannot be ruled out, nor can a deeper retracement towards 19.3000.”
USING A PROXY TO TRACK USD/MXN RETAIL POSITIONING
With respect to the difference in performance between USD/CAD and USD/MXN rates in recent weeks, it should be noted that the Canadian economy is more independent from the US economy than is the Mexican economy. While the United States is both countries’ largest trading partner, over 80% of Mexico’s exports go to the United States (compared to near 70% for Canada), while 30% of Mexico’s GDP is derived from economic activities involving the United States (compared to 20% for Canada).
The close proximity of both countries given their trade relationship with the United States also means that their currencies tend to trade in a similar fashion as well. In other words, there is a reasonable basis of expectation for USD/CAD and USD/MXN rates to trade in a similar fashion. To this end, the 20-day correlation between USD/CAD and USD/MXN rates is currently +0.81; one week ago, the 20-day correlation was +0.80.
IG CLIENT SENTIMENT INDEX: USD/CAD RATE FORECAST (NOVEMBER 24, 2020) (CHART 3)
(Click on image to enlarge)
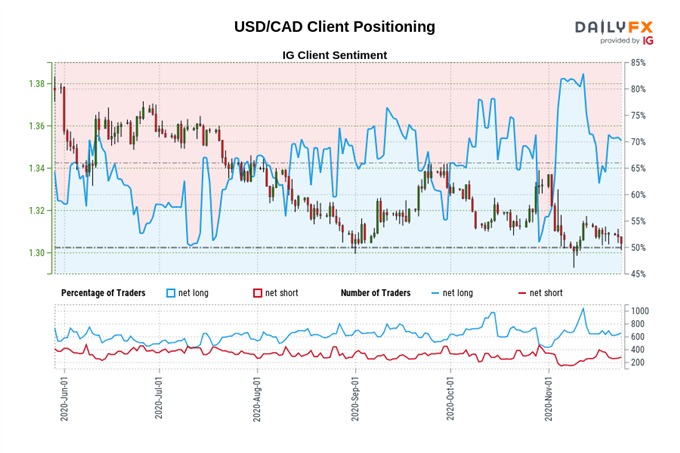
USD/CAD: Retail trader data shows 72.82% of traders are net-long with the ratio of traders long to short at 2.68 to 1. The number of traders net-long is 0.27% higher than yesterday and 3.09% higher from last week, while the number of traders net-short is 2.49% lower than yesterday and 37.59% lower from last week.
We typically take a contrarian view to crowd sentiment, and the fact traders are net-long suggests USD/CAD prices may continue to fall.
Traders are further net-long than yesterday and last week, and the combination of current sentiment and recent changes gives us a stronger USD/CAD-bearish contrarian trading bias.


