
Mega-Cap Tech Companies Retake The Spotlight As Bulls
Stocks have pushed to new highs yet again, given more positive signs of rising global GDP, strong economic reports here at home, another quarter of solid corporate earnings reports (especially those amazing mega-cap Tech companies), and an ever-improving outlook for passage of a tax reform bill. Likewise, inflows into U.S.-listed exchange-traded funds continued to reach heights never before seen, with the total AUM in the three primary S&P 500 ETFs offered by the three biggest issuers BlackRock, Vanguard, and State Street (IVV, VOO, SPY ) having pushed above $750 billion. On the other hand, discussion on Monday of a potential “phase-in” period for lowering tax rates has had some adverse impact on small caps this week, given that they would stand to benefit the most.
Nevertheless, I still see a healthy broadening of the market in process, with expectation of some rotation out of the mega-cap Tech leaders (despite their incredible surge last Friday) and into attractively-valued mid and small caps. But that dynamic has suddenly taken a backseat (once again) to those amazingly disruptive Tech juggernauts, who simply refuse to give up the limelight. Turns out, elevated valuations, unsustainable momentum, and the “law of large numbers” (hindering their extraordinary growth rates) don’t seem to apply to these companies, at least not quite yet. Their ability to disrupt, innovate, take existing market share, and create new demand seems to know no bounds, with infinite possibilities ahead for the Internet of Things (IoT), artificial intelligence (AI), machine learning, Big Data, virtual reality, cloud computing, e-commerce, mobile apps, 5G wireless, smart cars, smart homes, driverless transportation, and so on….
Still, the awe-inspiring performance and possibilities of these mega-cap Techs notwithstanding, longer term I remain positive on mid and small caps. Keep in mind, in many cases the growth opportunities of these up-and-comers are largely tied to supplying the voracious appetites of the mega-caps. So, it is a way to leverage the continued good fortunes of the big guys, who eventually will have to pass the baton to other market segments that display more attractive forward valuation multiples.
In this periodic update, I give my view of the current market environment, offer a technical analysis of the S&P 500 chart, review Sabrient’s latest fundamentals-based SectorCast rankings of the ten US business sectors, and then offer up some actionable ETF trading ideas. In summary, our sector rankings still look bullish, while the sector rotation model also maintains its bullish bias. A steady and improving global growth outlook continues to foster low volatility and an appetite for risk assets, while low-interest rates should persist. Notably, BlackRock recently posted a market outlook with the view that the US economic growth cycle may continue for years to come, and I agree – so long as the worldwide credit bubble doesn’t suddenly spring a leak and upset the global economic applecart. Read on....
Market overview:
Stocks just seem to go up almost every day while volatility remains low, so as MAD Magazine’s Alfred E. Neuman always used to say, “What, me worry?” Rather than being concerned about their investments, Americans have been free to focus on other pastimes, like the MLB World Series. Here in Santa Barbara, which is not too far from Los Angeles, there has been a lot of excitement about the Dodgers playing for the title. Of course, it would have been a huge financial boon for TV if the Yankees had won their Game 7 ALCS against the Astros: NY vs. LA, the two biggest cities, East Coast vs. West Coast, Wall Street vs. Hollywood, the classic rivalry between two storied franchises for the first time since 1981. But alas, it was not to be, and we are all happy for Houston to make the series – and to actually win it last night! – especially after its epic flooding disaster. Ultimately, the Astros would not be denied, pulling off another Game 7 win.
Although I now live near LA, I actually started my career in Houston in the oil industry as a structural engineer for Gulf Oil in the early ‘80s. In fact, I was just visiting Houston about five weeks ago, shortly after the floods, and I must say I was amazed at how quickly the city has returned to business-as-usual. Houston Strong, no doubt about it. And speaking of Gulf Oil, the company was acquired a few years after I joined them by Standard Oil of California for $13 billion in the largest takeover in corporate history at the time, and the combined entity was renamed Chevron Corp. Back then, you could buy a major oil company with an abundance of real assets in the ground for $13 billion, but today that much money can’t even buy a 55-person company like What’s App, a free mobile messaging app that sold to Facebook for $19 billion a few years ago. Yes indeed, the stock market is quite a bit higher now than in 1985. I often write about the Federal Reserve’s monetary policies of ZIRP and QE creating financial asset inflation….But as usual, I digress.
Although breadth has been generally good and performance dispersion wide, which is healthy for the sustainability of the bull advance, last Friday was all about those mega-cap Tech names, especially FAAMG – Facebook (FB), Amazon.com (AMZN), Apple (AAPL ), Microsoft (MSFT), Google (GOOGL) – led by Amazon’s +13% jump after its incredible earnings report and Apple’s selling out of iPhone X within minutes of accepting orders. In sum, the five FAAMG stocks added a combined $181 billion in market cap on that single day (with Jeff Bezos personally adding $10 billion in net worth to become the world’s richest person), and all five hit new highs. After stocks had pulled back in worried anticipation of those big-Tech earnings reports, the end result was a big relief rally. While the S&P 500 was +0.81% for the day and the Russell 2000 +0.72%, the Nasdaq Composite crushed it, up +2.2%, and the more concentrated Nasdaq 100 was up an incredible +2.9% for its biggest single-day gain in two years, driven by the dominant market-cap-weighting of FAAMG. So, is there anything wrong with this dominance of a few juggernauts, while the likes of JC Penney (JCP ) continue to get creamed in the marketplace? Perhaps not in the short term, but their supreme dominance certainly discourages new entrants, and there is a growing risk of a populist and protectionist-leaning movement pushing for anti-monopolistic measures. Remember the 2001 anti-trust case brought against Microsoft (MSFT)?
2017 has been a year for Growth and Momentum over Value and Quality. But after the market pulled back in mid-August, its initial recovery rally seemed to suggest a budding rotation into neglected market segments, including mids and smalls, as well as factors like Value, Low-volatility, and Quality. But then the Momentum factor started to kick back into gear, and Friday’s mega-cap Tech rocket ride put Growth and Momentum back to the forefront. Still, I firmly believe that a broadening into other market segments is required if this bull market is going to remain sustainable.
I have talked in previous articles about equity valuations being elevated but justified, given the climate of structurally low-interest rates, stable global economic growth, and solid (and improving) corporate earnings trends here at home. When you consider that the implied earnings yield of a 20x P/E ratio on the S&P 500 is 5%, stocks still look quite attractive compared to the 10-year Treasury yield at only 2.4%. Moreover, the dividend payout ratio for the S&P 500 (based on trailing operating earnings) is a fairly safe 40%. And Sabrient can find lots of compelling valuations in individual stocks flying under the radar, sporting attractive forward P/Es with strong expected year-over-year growth.
The CBOE Market Volatility Index (VIX), aka fear gauge, closed October at 10.18. Although investors are still wary that there hasn’t been a significant stock market correction since February 2016, complacency reigns supreme. Even during August’s brief spike in volatility, VIX peaked at 17.28 and has not approached the 20 panic level in a long time. Last Wednesday’s brief market pullback only pushed VIX to 13.20. But it is comforting to see the broadening participation across market segments, and in fact, low volatility is the historical norm when economic growth is stable. Performance dispersion among sectors has been higher, while correlations have been relatively low, which should continue to put downward pressure on the VIX .
And absent a systemic financial threat, low volatility should persist. Can another flash crash occur? Well, nothing is impossible, especially with all the algorithmic trading going on. But in the wake of 1987’s Black Monday crash (when S&P 500 fell 23%), the SEC instituted “circuit breakers” to halt trading at three separate levels of selloffs (7%, 13%, and 20%), and President Reagan established what today is euphemistically called the Plunge Protection Team (PPT) to stabilize markets in a crisis. And in the middle of the 2008-9 Financial Crisis, mark-to-market accounting requirement was changed, allowing for the use of orderly-market pricing rather than in forced-liquidation pricing. These measures lessen the risks of a crash significantly.
October proved to be yet another solid month. According to S&P Dow Jones Indices, the Dow Industrials blue chips gaining +4.4% and the S&P 500 large caps +2.3%, while the S&P MidCap 400 and the S&P SmallCap 600 gained +2.2% and +1.0%, respectively. Technology once again led among sectors, surging nearly +8% (and up +37% YTD), while Telecom fell nearly -8% as the worst performer. The S&P 500 Equal Weight (RSP) was up 1.1% in October, but the market-cap-weighted SPDR S&P 500 (SPY ) was up 2.2% over the same period, due to the FAAMG group.
Strong economic data (particularly the leading indicators), rising corporate earnings, low inflation, a still-accommodative Fed (guarding against causing disruptive financial shocks), low interest rates, an upsloping yield curve, persistent investor caution (especially among institutions and hedge funds), and some optimism about real tax reform all suggest no recession on the horizon and a favorable climate for equities. The so-called corporate “profit recession” ended in 2H2016, and profit growth is expected to persist at a double-digit pace into 2018 (and beyond). Moreover, the “capex recession” may be coming to an end, further helping corporate earnings to grow. Although tax reform would certainly be expected to ignite further capex, businesses in any case likely are ready to invest to improve the productivity of the workers they already employ, substitute for the workers they need but can’t find, and replace aging PP&E.
Chicago PMI rose from 65.2 to 66.2, with a 43-year high in backlog. Consumer Sentiment printed an impressive 100.7, while Consumer Confidence soared from 119.8 to 125.9 (a 17-year high). The Dallas Fed Manufacturing Survey jumped from 21.3 to 27.6 (a 10-year high). Q2 GDP was revised up to 3.1%, and the advance estimate from the BEA for final Q3 GDP is 3.0%. But the big news comes from the Atlanta Fed’s GDPNow model. On Monday, it was forecasting Q4 to come in at 2.9%. Then on Wednesday, its prediction jumped all the way up to 4.5%! Say what?! According to their website, “The forecasts of real consumer spending growth and real private fixed investment growth increased from 2.8 percent and 4.4 percent, respectively, to 4.1 percent and 8.8 percent, respectively, after this morning's Manufacturing ISM Report on Business from the Institute for Supply Management. The model's estimate of the dynamic factor for October – normalized to have mean 0 and standard deviation 1 and used to forecast the yet-to-be released monthly GDP source data – increased from 0.04 to 1.43 after the ISM report.” These were very impressive reports.
Furthermore, the global economy is expected to grow in the 3-4% range by year-end. In fact, all 45 countries tracked by the OECD are on course to post positive GDP growth this year, 33 of which (including the entire eurozone) should see higher growth rates than what they posted in 2016 – which would be the largest number of countries seeing an acceleration in growth since 2010.
As recently as one month ago, CME fed funds futures placed the odds of the next rate hike coming in December at 73%, but after all the strong economic and earnings news, futures now place the odds of a rate hike at or before the December meeting at 98%. The Fed has already begun unwinding its $4.5 trillion balance sheet as planned, but their slow rate of unwinding is intended to only gradually nudge up the longer end of the curve without harming borrowers or the mortgage market. The 10-year Treasury closed October at 2.38%, with the 2-year at 1.60%. So, the closely-watched 2-10 term spread closed October at only 78 bps, which is little changed over the past several months (and actually trending slightly lower) and still well under the 100 bps threshold of “normalcy,” the 101 bps on Election Day, and the 136 bps spread achieved after the November election.
In addition, credit spreads have been quite tight, with little reward to investors for taking on the higher risk in, for instance, high-yield “junk” bonds. Notably, some junk bond traders have turned to buying equities instead of bonds. And Morgan Stanley thinks spreads between Treasuries and residential mortgage-backed securities (RMBS) are due to widen, so they have proposed a pair trade involving a short-sell on RMBS and a long-position on 5- and 10-year Treasuries.
I have been saying for quite some time that global dynamics should keep Treasury yields in check, so long as the Fed remains slow and cautious in their path toward normalization. Drivers like global QE, the “carry trade” from ultra-low rate countries, aging demographics in developed countries, and capital inflows into fixed income funds (largely from 401k and IRA accounts for formulaic strategic allocations) are all perpetuating the demand for bonds, which is why I haven’t expected to see the 10-year yield rise to 3.0% anytime soon. My observation has been that 2.6% is a yield that has attracted a strong bid, such as last December and March. Likewise, I read that Gary Pollack, head of fixed-income trading at Deutsche Bank Private Wealth Management, said last week that the 2.6% level would entice him to buy, and BMO Capital Markets strategists wrote in a client report, “Anything between 2.5% and 2.6%...is a fairly strong buy level.”
Furthermore, Research Affiliates recently published an article(link is external) saying, “…the empirical evidence shows that low Treasury yields do not necessarily imply expensive bonds. Indeed, our research shows that macro fundamentals are major drivers of real interest rates and largely explain the historically low yield environment…we should not mistake a new normal of expected lower returns for a bond bubble.…A substantial share of this low yield can be explained by a secular downward trend in the rate of inflation and potential real GDP growth of the US economy.…Bonds have displayed a very valuable negative relationship with the US stock market, and thus have been an excellent hedge against macroeconomic risk. All in all, bonds are not as unattractive as a simple historical comparison of their yields may suggest.”
On the other hand, if corporate earnings keep up their strong trajectory and inflation picks up, some believe that rates could start to move above technical resistance levels, especially if an inflationary tax reform package passes – and the odds have indeed improved with the passage of the budget resolution by both the Senate and House, allowing a tax bill to be approved through the “reconciliation” process with just a simple majority in the Senate.
However, when total (public and private) debt-to-GDP expands like it has (currently estimated to be near 330%, comprising federal debt at 100% and corporate, household, and financial at 230%), there may be a limit to how far interest rates can rise without triggering defaults, given the financial leverage in our economy. Business defaults and bankruptcies, in turn, would lead to job losses and higher unemployment. And when you add to our total public and private debt all the other non-capitalized liabilities like public and private pensions and public entitlements (including Social Security, Medicare, Medicaid, welfare, food stamps, unemployment comp, etc.), that 300% number actually maybe 2 or 3 times higher in good times, and even higher in a slow-growth or recessionary environment. Furthermore, rising rates would be expected to slow the M2 money supply growth rate, ultimately slowing GDP growth. On the one hand, strong growth leading to inflation and higher interest rates should increase investment returns, but on the other hand, higher rates could torpedo our highly-leveraged economy. So, from the Federal Reserve’s standpoint, they must strike a delicate balance because upsetting the economic applecart through tighter monetary policy (i.e., overly-hawkish interest rate hikes or asset sales) is not an option. But I don’t think anyone knows for sure how high that rate threshold is.
The US economy has been growing at a rate of about 2% a year for the last 10 years, which computes to total cumulative growth of about 22%. But over the same timeframe, US government debt has risen about 100%, and U.S. stock prices are up around 200%. Some economists say that this is no big deal at all, while others say that we are simply kicking the day of reckoning down the road toward an ever-worsening disaster. No one really knows the end game for this – although some would argue that our liabilities matter less than our net worth (assets minus liabilities), and it is encouraging that our asset base in the US is quite strong.
In Europe, ECB president Mario Draghi continues to keep priming the pump, announcing a continuation of QE and keeping rates ultra-low such that Europe’s riskiest corporate bonds yield less than 10-year U.S. Treasuries, which are the safest. In developed markets like Germany, Switzerland, Holland, Japan, government bonds of the 7-year term or less are still paying negative rates. In total, something like $8 trillion reside in sovereign bonds paying negative interest rates. The game plan has been to print more money while keeping interest rates ultra-low (or even negative) to encourage borrowing, spending, and investing, rather than saving. In Japan, Prime Minister Abe was reelected, and the Nikkei index has gone parabolic the past couple of months, hitting a new 21-year high, even though Japan’s average age keeps rising due to low birthrates and low immigration while government debt has risen to 240% of GDP. Yes, Alfred E. Neuman lives in Japan, too. “What, me worry?”
In any case, it is pretty clear that the world is in the midst of an unprecedented global credit growth – leading many to worry about a massive bubble, the unwinding of which is rife with uncertainty. You may have heard mention recently of a potential “Minsky moment.” During the late twentieth century, American economist Hyman Minsky warned of a sudden collapse of asset prices following a long period of growth, sparked by debt or currency pressures. He identified three types of financing: 1) hedged financing, in which cash flows paid back principal and interest, 2) speculative financing, in which cash flows paid back interest only, necessitating a rolling over of maturing debt, and 3) Ponzi financing, which depended upon rising asset prices to remain solvent. As Fed chair, Janet Yellen said in a 2009 speech, “One of the critical features of Minsky’s worldview is that borrowers, lenders, and regulators are lulled into complacency as asset prices rise.” As I often discuss, our sole reliance in the US on the Federal Reserve’s monetary stimulus without complementary fiscal policies (tax and regulatory reform) has resulted in huge asset inflation with little in the way of wage inflation, leading to society’s widening wealth gap.
However, my biggest concern is not a debt bubble here at home or in Europe or Japan, but rather in China. Despite its opacity and authoritarian government, there is no denying that China has become the primary driver of global GDP growth. We got an indication of the impact China can have on global markets back in the summer of 2015 when they warned of slower growth and some rotation from a manufacturing emphasis to services and devalued the yuan. In the face of capital flight, China had to burn through reserves to keep the currency from falling further than their target. But the country quickly reversed the tide through strict capital controls (reducing pressure on its currency) and an explosion of new credit. As the country’s total debt-to-GDP continues to rise while ROI continues to fall, its economy requires accelerating credit growth just to maintain its GDP growth rate. Since summer of 2015, total debt – public and private – has expanded by something like $8 trillion, growing three times faster than the economy. Moreover, every aspect of the economy is tightly controlled. Businesses are rarely allowed to fail, as a true market-based economy would allow. Instead, the government bails out virtually all of them (and yes, I remember our own massive bailouts of the “too big to fail” banks). Nevertheless, although an investor would be hard-pressed to identify more than a handful of attractive Chinese companies for investment, global capital continues to flow into China – much of it via passive allocations to global markets, emerging markets, and BRIC.
Unlike Western capitalist economies that target monetary and fiscal policies to stimulate growth, which may or may not lead to GDP growth, China targets a GDP growth rate and does whatever it takes to hit it – including building shiny new factories that are seldom used and vast new cities that no one lives in. So, the assets they create don’t always produce an ROI. Thus, its leaders have deemed it necessary to raise interest rates and tighten capital controls, which will likely reduce economic growth to some extent. In addition, their protectionist policies continue to restrict foreign manufacturers who wish to target the massive Chinese consumer base, forcing them either to take a local partner (and thus sharing profits and intellectual property, which has led to rampant IP theft) or to build manufacturing in the Shanghai “free trade” zone (which comes with a hefty tariff).
In 2010, China’s government pledged to double the size of the economy by 2020, and to do so has relied upon an explosion in non-financial sector debt. Although the country’s opacity and strict autocratic control makes its true situation hard to assess, there is no doubt that corporate debt has skyrocketed since the government launched a massive stimulus program in response to the global financial crisis. GDP now stands around $12 trillion while rapid credit growth that has driven the country’s “official” total (public + private) from 100% debt-to-GDP to something like 400% in less than 20 years, and is likely much higher. In its annual health check report, the IMF wrote, “International experience suggests that China’s credit growth is on a dangerous trajectory, with increasing risks of a disruptive adjustment and/or a marked growth slowdown,” and called for “decisive action,” which of course China refutes. Similarly, the Bank for International Settlements has forecasted that excessive debt growth would lead to a banking crisis within the next three years, while S&P and Moody’s both downgraded China’s sovereign credit rating.
Why would China work so aggressively to create such a situation? Well, perhaps it was all in preparation for a triumphant showing at its 19th Communist Party Congress, in which President Xi Jinping’s name was just approved to be added to their Communist Party constitution, firmly ensconcing him as China’s most powerful leader since Mao Zedong. “What, me worry?”
Nevertheless, China has shown an amazing ability to manage its peculiar form of “bureaucratic capitalism” to keep the “China Miracle” in gear, and it could continue as long as the government keeps up its capital controls, central bank liquidity injections when needed, and support for state-owned enterprises. Falling productivity has been a problem for all economies, but particularly for China’s heavily subsidized system, so they will need to figure out how to reverse it. But history has shown that betting against this enigmatic country has been a losing proposition. According to FlexShares, China is launching an ambitious economic transformation to become a leading exporter of high-tech and capital, such as its proposed $900 billion “One Belt, One Road” (aka OBOR) strategy to revive the historic “Silk Road” connecting Asia, Africa, Middle East, and Europe by launching a massive infrastructure project of roads and railways, impacting 65 countries and 40% of global GDP, seeking to create deep economic and diplomatic relationships across four continents.
So, the ultimate outcome of the unprecedented global credit bubble is hard to predict and even harder to time, particularly with all the governments and central banks working hard to keep the gravy train moving ahead. There is a lot of potential upside to miss out on if an investor were to hunker down exclusively in cash (or cryptocurrency). And when you also consider the unprecedented explosion of technological innovation, consumer optimism, improving corporate capex, low-interest rates, and low volatility, the coast seems clear for the foreseeable future for US and global equities – including a likely continuation of the healthy broadening and market rotation we have begun to see.
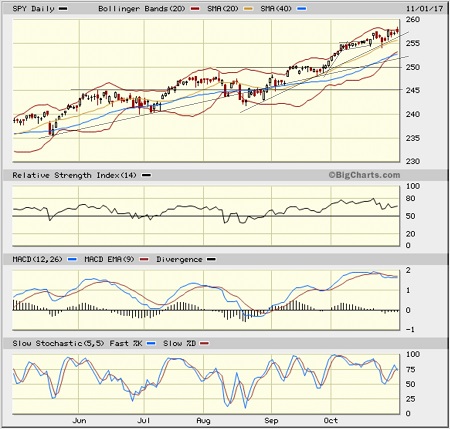
SPY chart review:
The SPDR S&P 500 ETF (SPY) closed Wednesday, November 1, at 257.49. The convincing breakout above the 250 level (corresponding to 2,500 on the S&P 500) at the end of September continued into early October, forming what appears to have been a bull flag continuation pattern (to catch its breath). The flag had an eager-looking upslope to it, then a slight pullback ahead of the earnings reports from some big tech bellwethers, and now the appearance of an important breakout. The 2-month uptrend line coincides with the 20-day simple moving average. Oscillators RSI, MACD, and Slow Stochastic are each in a position where they might either cycle a bit lower to gather steam or simply plow further ahead from here. Support comes at the 20-day SMA (approaching 256), then the breakout level at 255, followed by the 50-day SMA (near 252) that has been providing pretty solid support all year, then a prior breakout at 250, the 100-day (near 248), prior resistance-turned-support at 245, and the critical 200-day SMA (approaching 243). SPY still hasn’t tested its 200-day SMA since the election. I expect the bullish sentiment and technical breakout to hold at least through year end, unless some form of major unwanted (“Black Swan”) news event sends investors running for cover.
Note that the Dow Industrials, which is price-weighted, has suddenly outperformed the other indexes since early September on the backs of a handful of high-price stocks. So, some technicians are suggesting a pair trade of shorting the Dow and going long the S&P 500.
Latest sector rankings:
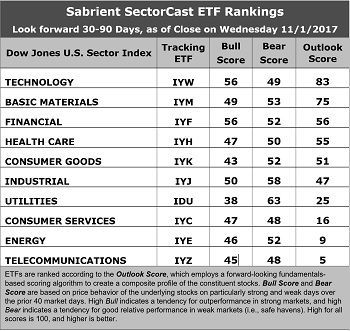
Relative sector rankings are based on our proprietary SectorCast model, which builds a composite profile of each of over 600 equity ETFs based on bottom-up aggregate scoring of the constituent stocks. The Outlook Score employs a forward-looking, fundamentals-based multifactor algorithm considering forward valuation, historical and projected earnings growth, the dynamics of Wall Street analysts’ consensus earnings estimates and recent revisions (up or down), quality and sustainability of reported earnings, and various return ratios. It helps us predict relative performance over the next 1-3 months.
In addition, SectorCast computes a Bull Score and Bear Score for each ETF based on recent price behavior of the constituent stocks on particularly strong and weak market days. High Bull score indicates that stocks within the ETF recently have tended toward relative outperformance when the market is strong, while a high Bear score indicates that stocks within the ETF have tended to hold up relatively well (i.e., safe havens) when the market is weak.
Outlook score is forward-looking while Bull and Bear are backward-looking. As a group, these three scores can be helpful for positioning a portfolio for a given set of anticipated market conditions. Of course, each ETF holds a unique portfolio of stocks and position weights, so the sectors represented will score differently depending upon which set of ETFs is used. We use the iShares that represent the ten major U.S. business sectors: Financial (IYF), Technology (IYW), Industrial (IYJ), Healthcare (IYH), Consumer Goods (IYK), Consumer Services (IYC), Energy (IYE), Basic Materials (IYM), Telecommunications (IYZ), and Utilities (IDU). Whereas the Select Sector SPDRs only contain stocks from the S&P 500, I prefer the iShares for their larger universe and broader diversity.
Here are some of my observations on this week’s scores:
1. Technology remains in the top spot with an Outlook score of 83, followed by Basic Materials with a score of 75. Tech displays a strong projected EPS year-over-year growth rate of 15.4%, the best Wall Street sell-side analyst sentiment (i.e., net positive revisions to EPS estimates), the highest return ratios, and a low forward PEG of 1.20 (ratio of forward P/E to forward EPS growth rate). Basic Materials boasts strong sentiment from sell-side analysts, along with solid return ratios. Financial and Healthcare come in third and fourth, primarily due to having the lowest forward P/Es of 17.6x and 16.7x, respectively. Rounding out the top six are Consumer Goods (Staples/Noncyclical) and Industrial. Then there is a gap down to Utilities. Given the market’s continued strength, it might be surprising to point out that many of the sector forward P/Es are actually lower than they were last month, as EPS expectations have been lifted (for example, Healthcare has fallen from 17.5x to 16.7x).
2. Telecom and Energy continue to be the bottom dwellers with Outlook scores of 5 and 9, respectively. Both display generally weak scores across the board, including the highest forward P/Es (around 23x-26x). However, Energy notably displays by far the best projected EPS year-over-year growth rate of 29.8%, and the lowest forward PEG of 0.86.
3. Looking at the Bull scores, Technology, and Financial share the top score of 56, as both have displayed relative strength on strong market days, while Utilities is the lowest at 38. The top-bottom spread is 18 points, which reflects low sector correlations on strong market days, which is favorable for stock picking. It is desirable in a healthy market to see low correlations reflected in a top-bottom spread of at least 20 points, which indicates that investors have clear preferences in the market segments and stocks they want to hold (rather than broad risk-on behavior).
4. Looking at the Bear scores, we find Utilities at the top with a score of 63, followed by Industrial at 58, which means that stocks within these sectors have been the preferred safe havens lately on weak market days. Telecom and Consumer Services (Discretionary/Cyclicals) share the lowest score of 48, as investors have fled during market weakness. The top-bottom spread is 15 points, which reflects relatively low sector correlations on weak market days, which is favorable for stock picking. Ideally, certain sectors will hold up relatively well while others are selling off (rather than broad risk-off behavior), so it is desirable in a healthy market to see low correlations reflected in a top-bottom spread of at least 20 points.
5. Technology displays by far the best all-around combination of Outlook/Bull/Bear scores, while Telecom is by far the worst. Looking at just the Bull/Bear combination, Financial and Industrial are the best, followed by Technology, indicating superior relative performance (on average) in extreme market conditions (whether bullish or bearish), while Telecom scores the worst, as investors have generally avoided the sector.
6. This week’s fundamentals-based Outlook rankings reflect an increasingly bullish bias, given that five of the top six sectors are economically-sensitive or all-weather (Technology, Materials, Financial, Healthcare, Industrial). Keep in mind, the Outlook Rank does not include timing, momentum, or relative strength factors, but rather reflects the consensus fundamental expectations at a given point in time for individual stocks, aggregated by sector.
ETF Trading Ideas:
Our Sector Rotation model, which appropriately weights Outlook, Bull, and Bear scores in accordance with the overall market’s prevailing trend (bullish, neutral, or defensive), displays a bullish bias and suggests holding Technology (IYW), Financial (IYF), and Materials (IYM), in that order. (Note: In this model, we consider the bias to be bullish from a rules-based trend-following standpoint when SPY is above both its 50-day and 200-day simple moving averages.)
Besides iShares’ IYW, IYF, and IYM, other highly-ranked ETFs in our SectorCast model (which scores nearly 700 US-listed equity ETFs) from the Technology, Financial, Materials sectors include PowerShares Dynamic Semiconductors Portfolio (PSI), iShares Edge MSCI Multifactor Financials (FNCF), and VanEck Vectors Steel ETF (SLX).
If you prefer a neutral bias, the Sector Rotation model suggests holding Technology, Basic Materials, and Financial, in that order. On the other hand, if you are more comfortable with a defensive stance on the market, the model suggests holding Utilities, Industrial, and Basic Materials, in that order.
An assortment of other interesting ETFs that are scoring well in our latest rankings include iShares US Home Construction (ITB), AlphaMark Actively Managed Small Cap (SMCP), Direxion iBillionaire Index (IBLN), Arrow QVM Equity Factor ETF (QVM), WBI Tactical SMG Shares (WBIA), ALPS Buzz US Sentiment Leaders (BUZ), Guggenheim Invest S&P 500 Equal Weight Technology (RYT), First Trust NASDAQ-100 Tech Sector Index Fund (QTEC), VanEck Vectors BDC Income ETF (BIZD), PowerShares Contrarian Opportunities Portfolio (CNTR), ALPS Barrons 400 (BFOR), SPDR S&P Metals & Mining (XME), and First Trust NASDAQ Smartphone Index Fund (FONE).
Disclaimer: This newsletter is published solely for informational purposes and is not to be construed as advice or a recommendation to specific individuals. Individuals should take into ...
more

