
Median Household Income In January 2019
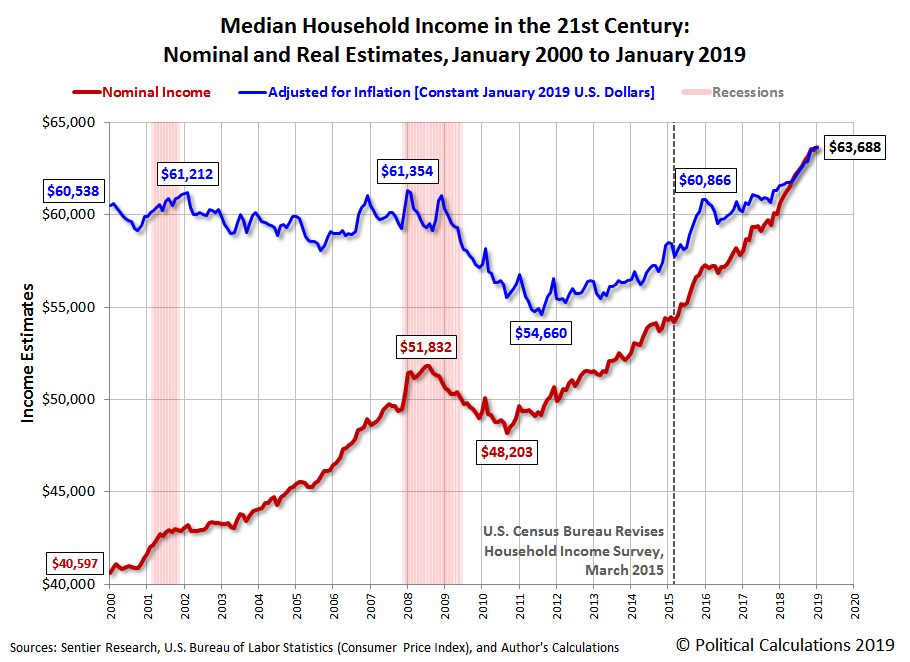
Median household income in the United States rose to $63,688 in January 2019, a 0.3% increase over the Sentier Research's estimate of $63,517 for December 2018. The following chart shows the nominal (red) and inflation-adjusted (blue) trends for median household income in the United States from January 2000 through November 2018. The inflation-adjusted figures are presented in terms of constant January 2019 U.S. dollars.
While the overall trend since December 2016 remains positive for U.S. median household income growth, the rate at which it is growing appears to be starting to slow, which can be seen in the following chart showing the year-over-year growth rate:

Historically speaking, the nominal growth rate is still well elevated near its recent record high, but it's something to watch as the U.S. economy's exposure to well established adverse headwinds from the global economy increases and the chickens come home to roost from the Fed's rate hikes of 2018.
Analyst's Notes
The partial government shutdown earlier in the year has impacted our ability to develop an estimate of median household income using our alternate methodology, where the data we use won't be available until 1 March 2019, assuming the U.S. Bureau of Economic Analysis doesn't change that target date again.
In generating inflation-adjusted portion of the Median Household Income in the 21st Century chart and the corresponding year-over-year growth rate chart above, we've used the Consumer Price Index for All Urban Consumers (CPI-U) to adjust the nominal median household income estimates for inflation, so that they are expressed in terms of the U.S. dollars for the month for which we're reporting the newest income data.
References
Sentier Research. Household Income Trends: January 2000 through January 2019. [Excel Spreadsheet with Nominal Median Household Incomes for January 2000 through January 2013 courtesy of Doug Short]. [PDF Document]. Accessed 21 January 2019. [Note: We've converted all data to be in terms of current (nominal) U.S. dollars.]
U.S. Department of Labor Bureau of Labor Statistics. Consumer Price Index, All Urban Consumers - (CPI-U), U.S. City Average, All Items, 1982-84=100. [Online Database (via Federal Reserve Economic Data)]. Last Updated: 13 February 2019. Accessed: 13 February 2019.
Disclaimer: Materials that are published by Political Calculations can provide visitors with free information and insights regarding the incentives created by the laws and policies described. ...
more

