Median Household Income In December 2020
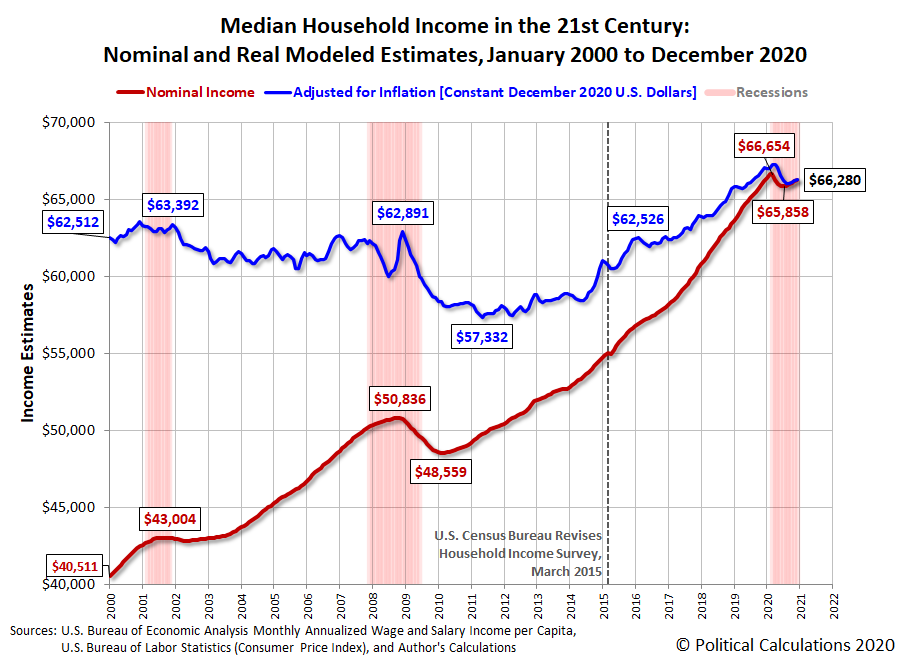
Political Calculations' initial estimate of median household income of in December 2020 is $66,280, an increase of $113 (or 0.17%) above the initial estimate of $66,167 for November 2020.
The latest update to the chart tracking Median Household Income in the 21st Century shows the nominal (red) and inflation-adjusted (blue) trends for median household income in the United States from January 2000 through December 2020. The inflation-adjusted figures are presented in terms of constant December 2020 U.S. dollars.
Median household income in the United States has been rebounding since July 2020, where revised data puts the bottom at $65,858. Through December 2020, the wage and salary income earned by a typical American household has increased by $422, or 0.6%. Median household income previously peaked at $66,654 in March 2020, just before state and local government COVID-19 lockdowns threw the U.S. economy into recession. December 2020's initial estimate of $66,280 indicates the median income-earning household has now recovered more the half the loss recorded during the early months of the coronavirus pandemic.
Analyst's Notes
For December 2020, the BEA issued minor revisions of the received aggregate wage and salary dispersement data we utilize in generating our estimates of median household income for the months of October and November 2020.
Other Analyst's Notes
Sentier Research suspended reporting its monthly Current Population Survey-based estimates of median household income, concluding their series with data for December 2019 before ceasing to operate in early 2020, as its principals have retired. In their absence, we are providing the estimates from our alternate methodology for estimating median household income on a monthly basis. Our data sources are presented in the following section.
References
Sentier Research. Household Income Trends: January 2000 through December 2019. [Excel Spreadsheet with Nominal Median Household Incomes for January 2000 through January 2013 courtesy of Doug Short]. [PDF Document]. Accessed 6 February 2020. [Note: We've converted all data to be in terms of current (nominal) U.S. dollars.]
U.S. Department of Labor Bureau of Labor Statistics. Consumer Price Index, All Urban Consumers - (CPI-U), U.S. City Average, All Items, 1982-84=100. [Online Database (via Federal Reserve Economic Data)]. Last Updated: 13 January 2021. Accessed: 13 January 2021.
U.S. Bureau of Economic Analysis. Table 2.6. Personal Income and Its Disposition, Monthly, Personal Income and Outlays, Not Seasonally Adjusted, Monthly, Middle of Month. Population. [Online Database (via Federal Reserve Economic Data)]. Last Updated: 29 January 2021. Accessed: 29 January 2021.
U.S. Bureau of Economic Analysis. Table 2.6. Personal Income and Its Disposition, Monthly, Personal Income and Outlays, Not Seasonally Adjusted, Monthly, Middle of Month. Compensation of Employees, Received: Wage and Salary Disbursements. [Online Database (via Federal Reserve Economic Data)]. Last Updated: 29 January 2021. Accessed: 29 January 2021.
Disclaimer: Materials that are published by Political Calculations can provide visitors with free information and insights regarding the incentives created by the laws and policies described. ...
more


