
Measuring Return Streaks, Part II
<< Read More: Measuring Return Streaks — Another Metric For Your Toolkit, Part I
Yesterday we reviewed the basics for calculating so-called performance streaks in markets. Let’s go a bit deeper and slice and dice the data with a bit more granularity.
As a quick recap, a streak here is defined as upside or downside performance trends that continue with an uninterrupted change until some trigger point is reached. That is, for an x% upside streak, the event continues until there’s a countermove of x% loss. For the examples below, let’s look at the S&P 500 since 1960 for 20% return triggers, up or down. Why 20%? That’s a commonly used measure for defining bear markets – 20% declines. We’ll use the same change on the upside.
The first chart shows all the positive and negative 20% streaks for the S&P since 1960. Not surprisingly, the upside runs deliver bigger gains vs. the losses. The market, in other words, has a strong upside bias and that’s clear in the upside streaks vs. their downside counterparts.

How long do these 20% streaks last? Let’s break the data out into gains and losses, starting with the former. In the chart below, it’s clear that 20% upside streaks vary widely, ranging from as short as 47 trading days to a slow-cooker that lasted nearly 4,500 trading days. The market tends to dispense profits through time, but sometimes gains roll out like molasses.

On the slip side, the length of downside streaks is shorter (usually), although sitting through the longer periods of negative events can test the patience of even the most disciplined investors. Indeed, the two longest downside streaks for 20% losses lasted more than 600 trading days – nearly two years.

Note that the last two 20% loss streaks were relatively brief affairs – 62 and 33 days. That’s unusually short relative to history. Is that a sign that 20% decline events are becoming shorter events? Unclear if this is a temporary or permanent change, but the last two episodes open the possibility that downside periods for the market are, like everything else in the 21st century, speeding up in terms of time duration.
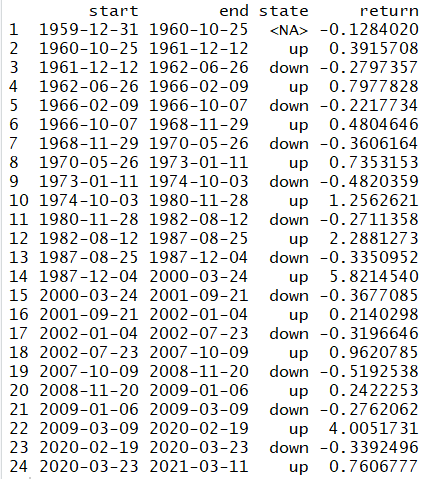
Finally, here’s all the data in table form:
Disclosures: None.


