Markets Running Hot, Hot, Hot
On the heels of the State of the Union address Tuesday night, equity futures are pointing to modest decline at the open of trading on Wednesday. In assessing the SOTU address, we’re of the opinion it was rather innocuous with points of articulation that spanned from global trade to domestic political strife and found with sprinkles of economic data points. As our political parties will likely continue to bicker over the future implementations of legislature, the government is just 10 days away from the threat of another government shutdown. Investors have been increasingly accustom to focus on the political picture given the shortcomings in delivering of economic data since the last government shutdown that proved record-setting in duration. Since the government shutdown, dribs and drabs of December economic data have been slow coming. Some of the most important pieces of data are still unknown including monthly retail sales, Personal Consumption and Expenditures and Q4 2018 GDP just to name a few. Some of the data that has been delivered of late has proven favorable, but some of the data like factor orders shows signs of continued slowing.
Factory orders in the U.S. fell more sharply than expected in November showing a slowdown in growth in the industrial segment of the economy toward the end of 2018. A key measure of business investment also declined. Orders dropped 0.6% in November. Economists polled by MarketWatch had forecast a 0.2% decline, largely because of lower oil prices. The report had been delayed by the 35-day partial government shutdown.
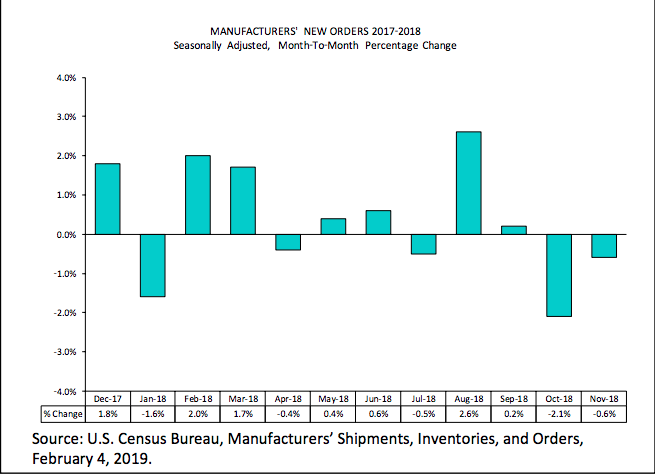
A closely followed gauge of business investment, known as core orders for durable goods, declined by 0.6% in November. It was the third drop in four months, suggesting companies were more hesitant to invest. The ongoing trade spat with China has been a major source of uncertainty and worries about a recession were especially pronounced during a market slump near year-end.
Business sentiment is a driving force for factory orders and durable goods and much of the 2018 positive business sentiment had given way to capital preservation in the last few months of the year. Much of the blame for capital preservation centers on fears over global trade feuds and the domestic political feuding that resulted in the longest government shutdown in U.S. history.
“Fears of recession, the government shutdown, trade policy uncertainty, and slower global growth have likely dampened capital spending in December and January,” said chief economist Scott Brown of Raymond James. “The key question is whether this will prove to be a temporary lull or something longer-lasting.”
While we can’t quite yet determine total retail sales growth for 2018 and for the aforementioned reasons, citing lack of December data, the National Retail Federation is out with their 2019 forecast. The NRF forecasts U.S. retail sales to rise between 3.8% and 4.4% to more than $3.8 trillion in 2019. The trade group and data tracker is citing high consumer confidence, low unemployment and rising wages as the main reasons for continued retail sales growth in 2019. Preliminary estimates show retail sales grew 4.6% in 2018 to $3.68 trillion, exceeding the retail industry group’s forecast for growth of at least 4.5 percent.
“More people are working, they’re making more money, their taxes are lower and their confidence remains high,” NRF President and Chief Executive Matthew Shay said in a statement.
The biggest priority is to ensure that our economy continues to grow and to avoid self-inflicted wounds. It’s time for artificial problems like trade wars and shutdowns to end, and to focus on prosperity not politics."
As part of the NRF’s economic forecast and review for 2019, the organization expects the overall economy to gain an average of 170,000 jobs per month in 2019, down from 220,000 in 2018, and that unemployment – currently at 4%– will drop to 3.5% by the end of the year.
Boosted by rising wages, robust job growth and lower gas prices, consumer research firm Customer Growth Partners (CGP) said on Monday retail sales in 2019 will total $3.77 trillion, up 5 percent from $3.59 trillion in 2018, the fastest growth pace since 2006.
Last, but certainly not least on the economic data front was the latest ISM services reading. Remember, the theme of much of the economic data of late is “slowing growth”, but growth nonetheless. We encourage investors to understand the difference between slowing growth and contraction. In it’s most simplistic definition, slowing growth is still a derivative of growth. We may not be eating increasingly more hamburgers, but we are still eating more hamburgers when compared to last year. So let’s take a look at those ISM numbers…
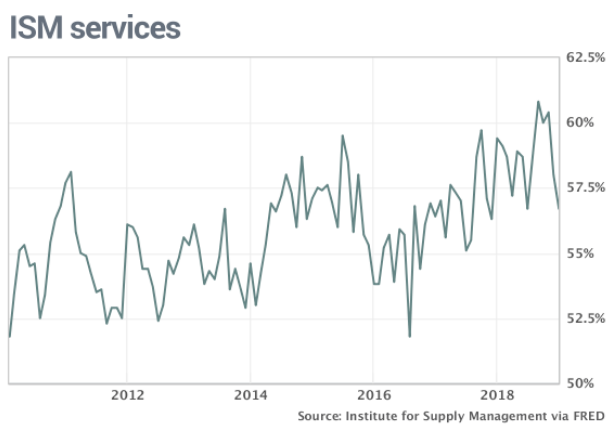
An index of businesses minus the manufacturing sector slipped to 56.7% in January from 58%, the Institute for Supply Management said on Tuesday. The latest reading fell short of Wall Street’s forecast and marked the lowest reading since July. Companies reported slower growth in new orders, production, and employment, but each of these sub-indexes were all north of the 55 percent. Again, slowing growth! And again from within the weakened reading on a month-to-month basis the survey pushes some of the blame from the weakening reading squarely on the government shutdown and other political concerns.
Some executives expressed worries about the partial government shutdown, but they remained “mostly optimistic about overall business conditions,” said Anthony Nieves, the chairman of the survey.
Even with some of the released economic data from either December or January showing slowing growth in the U.S. economy, the markets have trended higher. The S&P 500 is now up a whopping 9.2% in 2018. The benchmark index narrowly missed hitting it’s 200-DMA in Tuesday’s trading session, possibly setting itself up for a “blow-off-the-top” move in the near-term. The extreme rally in the markets has come after an extreme technical bear market and all the while fund flows have been negative. It’s an interesting tell on the state of investor psychology. Additionally, it is very rare to find large equity fund outflows paired with major equity market rallies as depicted in the chart below.
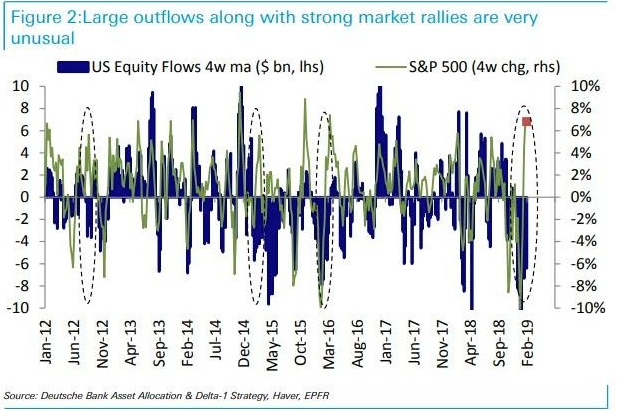
While we know that institutional investors have been extrapolating capital from the equity markets of late, we also know that retail investors were doing much the same through Q4 2018, but may have turned bullish in early 2019 and as markets surged.
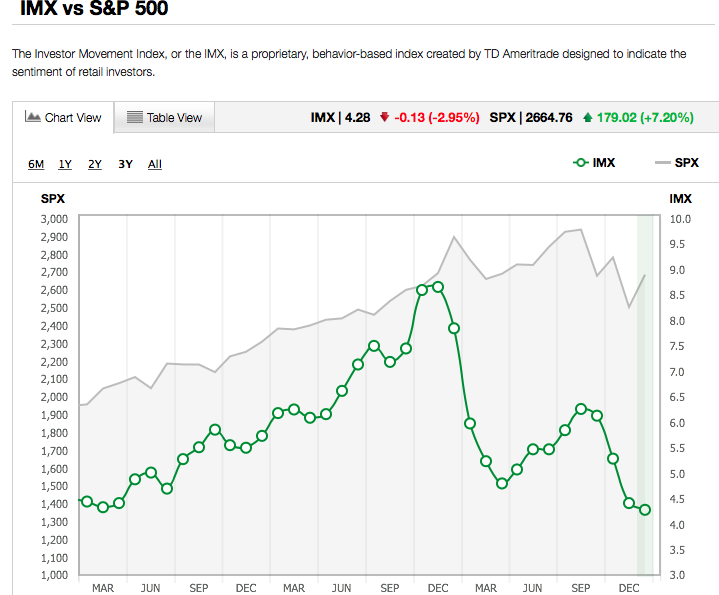
The TD-Ameritrade Investor Movement Index (IMX) showed that investor outflows were at there heaviest in Q4 2018. But that tide turned to some degree in January 2019. The IMX decreased for the fourth month in a row in January, moving down 2.95% to 4.28 from a previous score of 4.41.
TD Ameritrade clients were once again net buyers during the January period. Buying among equities was light, with clients favoring less risky assets, including fixed-income products. This activity, along with decreasing relative volatility among widely held securities, including General Electric (GE) and Microsoft (MSFT), helped push the IMX score lower.
“Apple Inc. (AAPL) was a net buy as the company reached a 52-week low during the period and announced plans to release three new iPhone models this fall. AT&T Inc. (T) was a net buy after Hulu, which is jointly owned by T, announced it was lowering the price of its basic, ad-supported subscription plan from $7.99/month to $5.99/month. General Electric Inc. (GE) announced a deal to combine its locomotive business with railroad parts supplier Wabtec (WAB), and was net bought. Amazon Inc. (AMZN) was a net buy after announcing testing of Amazon Scout, an autonomous electric delivery project, in which robots deliver packages. Ford Motor Company (F) was a net buy after missing on earnings during the period, while the CEO released a note rallying employees to double profit in 2019.
Additional popular names bought include Berkshire Hathaway Inc. (BRK.B), Altria Group Inc. (MO), and Microsoft Inc. (MSFT). Social media companies Facebook Inc. (FB) and Twitter Inc. (TWTR) were net sold once again during the January period. FB is among the technology companies that continue to face growing backlash regarding their increasing size and power from politicians, consumers, and even business partners, while TWTR CEO Jack Dorsey admitted that the company can do a better job at removing misleading information. Biotechnology companies Celgene Corp. (CELG) and Gilead Sciences Inc. (GILD) were both net sold during the period. CELG received multiple analyst upgrades and was up over 20% during the period, while GILD announced an immune-oncology partnership with Agenus Inc. (AGEN). Bank of America (BAC) was net sold after the stock rebounded from December lows following an analyst upgrade to the banking sector. Raytheon (RTN) was up over 10% during the period after the company won multiple government contracts, and was net sold.”
The breadth of the market move in January and thus far in the early February period has been favorable and found with strong internal readings. Such readings are now suggesting the market is in overbought territory, as the S&P 500 attempts to hit and close above its 200-DMA.
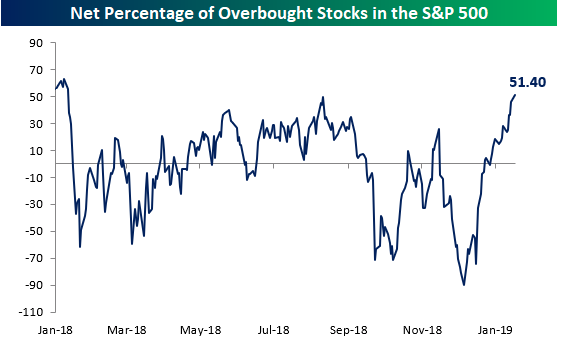
With the steady gains in the market lately, the percentage of stocks in the S&P 500 trading at overbought levels continues to trend higher. As of yesterday’s close, a net of 51.4% of the stocks in the S&P 500 are trading at overbought levels (>1 standard deviation above 50-DMA), and that’s the highest reading since late January 2018 when the percentage reached 63.4 percent.
When I look for reasons underlying the strength of the market presently we are forced to recognize that sentiment is part of the reason, even with sentiment remaining less bullish than the historical average. We understand and recognize fund flows aren’t favorable. Furthermore, I know that earnings growth is slowing and based on FactSet’s forecast, earnings are expected to decline in Q1 before rebounding through 2019. So what gives?
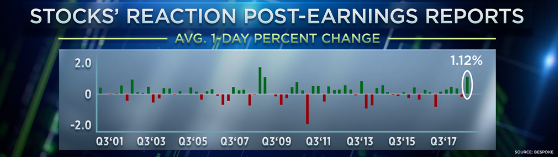
According to Bespoke Investment Group co-founder Paul Hickey, companies are seeing their strongest stock price performances on the days they’re reporting earnings in a decade.
“We’re seeing investors come in, bid up stocks at the open and that strength follows throughout the trading day. There’s really been a rush into these names as they’ve been reporting.
Coming into earnings season, we were noting how analysts’ negative revisions were at the worst rate to the downside since 2015-2016. So, it set the bar really low,” he said. “The market sentiment was so washed out, and we’re just seeing stocks rally.”
It’s clear from the market devaluation in Q4 2018 that the bar was indeed reset and reset lower for the reporting season. Additionally, the bar had been set so low that it’s proving an “easy beat” for those companies that have reported Q4 results to-date. According to FactSet, 70% of S&P 500 companies have reported a positive EPS surprise and 62% have reported a positive revenue surprise. What’s more, EPS estimates for Q1 have also been lowered.
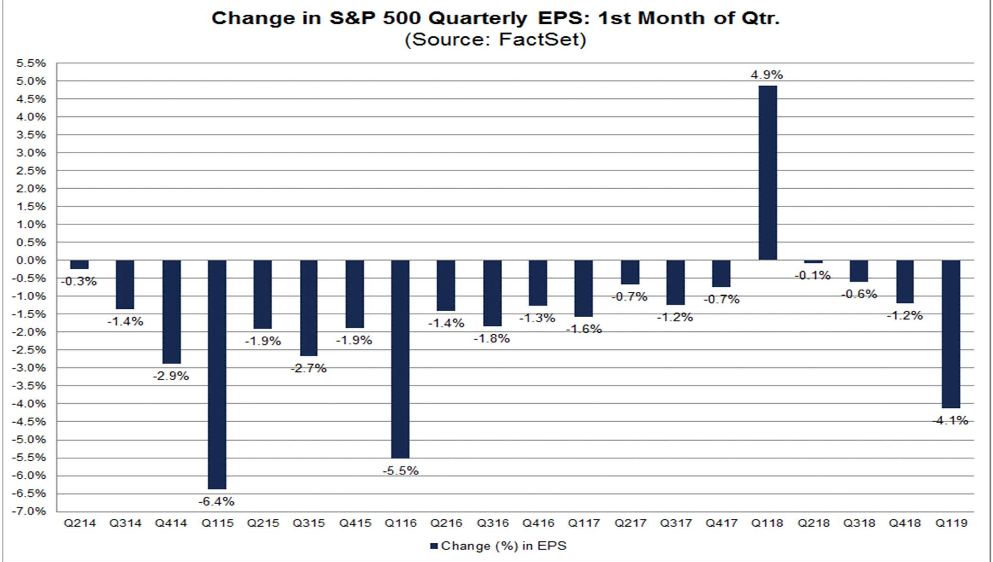
As Finom Group (for whom I am employed) offered in our Weekly Research Report, during the month of January, analysts lowered earnings estimates for companies in the S&P 500 for the first quarter. The Q1 bottom-up EPS estimate (which is an aggregation of the median EPS estimates for all the companies in the index) dropped by 4.1 percent. The decline in the bottom-up EPS estimate recorded during the first month of the first quarter was larger than the 5-year, 10-year, and 15-year averages. In fact, the first quarter marked the largest decline in the bottom-up EPS estimate during the first month of a quarter since Q1 2016 (-5.5%). As we have mentioned in previous Weekly Research Reports, the current market fears and market correction greatly mirror the fears that surfaced in late 2015 and persisted through early 2016, but then subsided with a strong economic and global equity market performance.
Given the lowered earnings forecasts/lower bar, investors are simply responding positively to earnings and revenues that are not as bad as previously feared. And if all that was feared with respect to the macro-picture subside and resolve favorably, the market may still have significant upside in 2019 and should growth accelerate. Nonetheless, the market won’t likely go up in a straight line. For now, those algos and/or programmed trading mechanisms are keying technical levels and taking them out one-by-one and as they did so on the way down in October-December of 2018. And always in keeping with the macro-picture, we have to maintain a watchful presence on market liquidity.
As our Alphabet acronym (E-F-G) theme for 2019 markets carries forward we are forced to recognize the role that liquidity has played in facilitating market directional trends. Since Fed Chairman Jerome Powell paused the rate hike process and the People’s Bank of China (PBOC) stepped up liquidity injections, the global money supply has round-tripped to March 2018 levels.
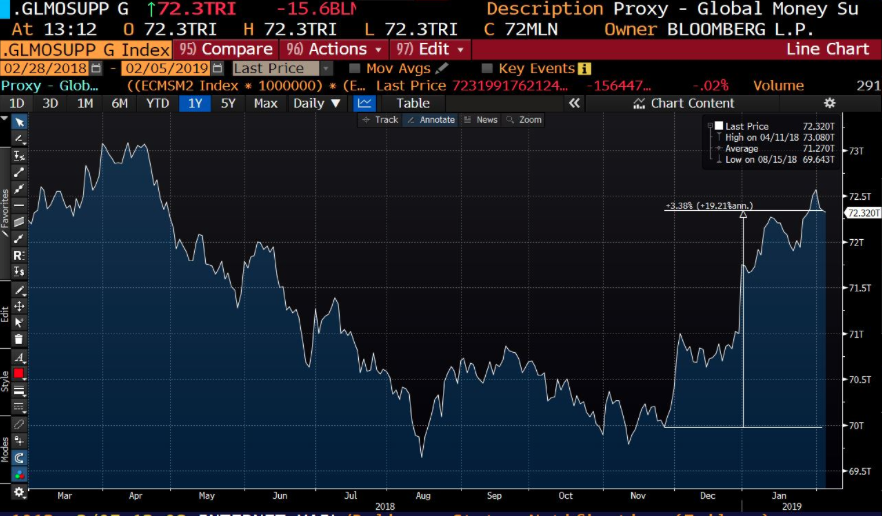
It’s clear to see from the chart above that December 2018 marked the depth and recovery of global money supply and where central banks became liquidity proponents of the market.
In rounding out this Daily Market Dispatch I’ll leave you with a recent note from Canaccord Genuity strategist Tony Dwyer and Finom Group's daily technical market recap from Wayne Nelson. Click link to view.
“Investors suffered through the third ‘recession’ scare this cycle, and while all three major corrections have been larger than anticipated, absent an inversion of the yield curve that shuts down credit, the market pessimism following a non-recession crash should set the stage for new highs in 2019.”
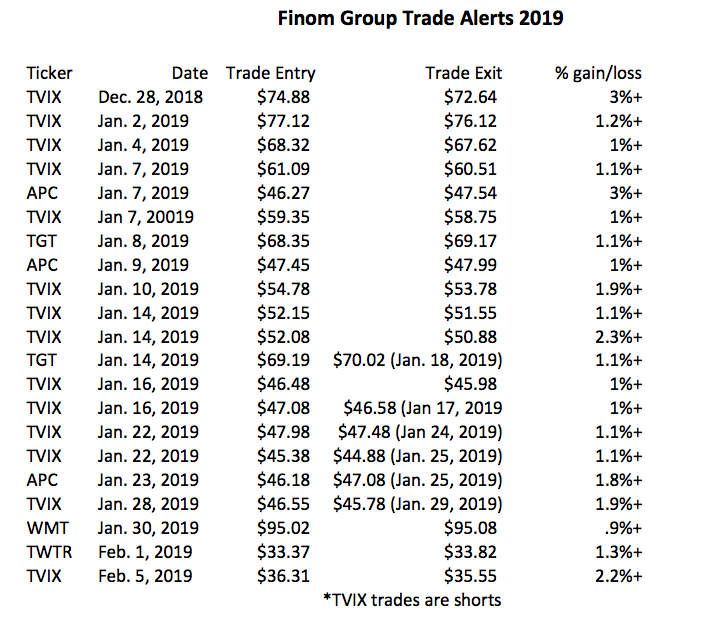
Stay tuned for this evening's release of Finom Group's State of the Market video. Our YTD trade alerts are shown below and all found profitable!