
Markets Plunge 15%! How Will You Trade?
The UK and US stock markets have suffered their worst days since the 2008 Global Financial Crisis, plummeting by 15% on March 9. This follows a steep crash in the oil price, amplified by concerns about the economic cost of the coronavirus pandemic.
The FTSE 100 lost almost GBP125 billion, or 7.7%, making March 9 the fifth worst day in history for the index, which finished below 6,000 points. This brings the FTSE 100 to its lowest level since the 2016 Brexit vote.
Meanwhile, the Dow Jones closed down by 7.8%, dropping more than 2,000 points for the first time in history.
What caused the crash?
The stock market crash follows increasing economic losses due to the coronavirus pandemic, as the world's major governments struggle to bring local travellers home and to contain the outbreak.
In addition, oil markets dropped, with the coronavirus outbreak affecting the demand for crude oil. Tensions between Saudia Arabia and Russia remain high over oil production cuts, with Russia refusing to sanction cuts that would support the oil price, and Saudi Arabia pledging to increase production.
This sent the oil price crashing on Monday by more than 30% at one point, dropping to about $35 a barrel. Consequently, oil stocks were the ones that recorded the day's most severe losses:
- BP - down 18%
- Total down 17%
- Chevron down 14%
With continuing international tensions and the coronavirus still spreading, we can expect continued volatility in the coming days.
How can you trade?
While market volatility is often cause for increased panic in the media, volatility can lead to opportunity for savvy traders. As CFDs give traders the ability to trade long or short, CFD traders have the opportunity to profit in both rising and falling markets.
And, with Admiral Markets, there are 4,000+ markets to choose from, including CFDs on commodities like WTI and Brent crude oil, major stocks, and indices like the Dow Jones, FTSE, SP500 and Nasdaq.
If you had opened a short trade on one lot of Brent crude oil (one lot = 100 CFDs) at $45.90 at 23:00 EET on March 6, and then closed the trade at $35.73 on March 9 when the markets opened, you could have have a profit of $1,017.
(Click on image to enlarge)
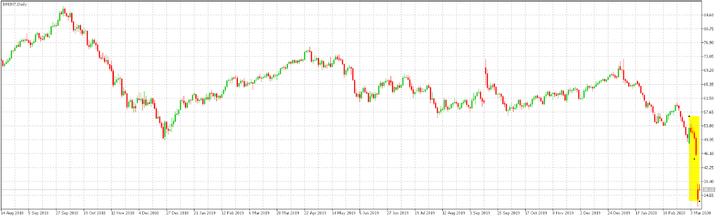
Source: Admiral Markets MT5 with MT5-SE Add-on, Brent CFD Daily chart (between August 14, 2018, to March 10, 2020). Accessed: March 10, 2020, at 9:30am EET - Please note: Past performance is not a reliable indicator of future results, or future performance.
Note that trading does involve risk, and if you had have opened a buy trade, you would have lost the same amount.
In any case, with extreme volatility in oil stocks, US and UK stock indices and commodities, this brings many opportunities for traders. How will you trade?
Disclaimer: The given data provides additional information regarding all analysis, estimates, prognosis, forecasts or other similar assessments or information (hereinafter "Analysis") ...
more

