
Markets: – Reckoning
Dread. There is a sense of reckoning due for markets as the FOMC considers its policy and markets pay for the years of easy money and QE unwinding to neutral and beyond. If the Powell Fed distrusts R* and other models then we are navigating with dead reckoning with dot-plots and futures. The permutations for today are many with words mattering as much as actions as there is the dovish hike, the hawkish hold, and the extremes of a dovish hold along with hawkish hike. The infamous dot-plots will play a role as well with 2 hikes for 2019 down from 3 now expected – indicating to many that the line of Fed expectations is the cap rather than the floor for rates going forward.
The way the Fed explains itself will matter significantly for understanding the market reaction as too dovish a tilt will add to 2020 recession fear and too hawkish will as well. This is the reckoning fear that drives the bear market globally. We are damned if they do or don’t depending on their logic.
Quite clearly, the Powell Fed would like to disassociate itself from the Greenspan S&P500 put. But the oil put maybe another story as the reversal of fortune in oil prices matters to inflation rates globally, FX everywhere and to the real economy. The S&P500 put rest on the confidence game, which has been shattered since February for markets and is beginning to turn for corporations since October. This volatility of expectations drives hope for a FOMC response to financial conditions as well. Reckoning which why Powell acts and talks is now all but finished as dread and waiting for the bill dominated overnight price action. There was plenty of economic data from Japan trade deficit increases to New Zealand C/A deficits to weaker Swedish confidence and higher prices than expected in UK and Germany – none of which mattered. Rather the negative Facebook reports on privacy wall end-arounds for Amazon, Microsoft, Apple and others seems to add to risk-off gloom. Or the reality that India is now expected to rise to 5thplace in global GDP pushing out the UK down to 7th. Emerging markets remain key to understanding the present fear with China and India central to 2019 forecasts for Europe and US growth. This puts the USD and Oil as the two markets that maybe the most helpful in watching risk today both before and after 2 pm.
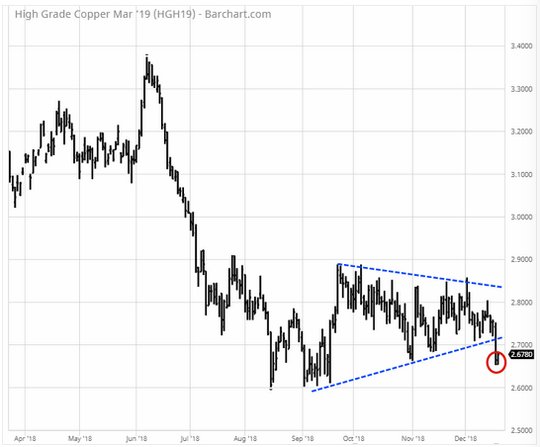
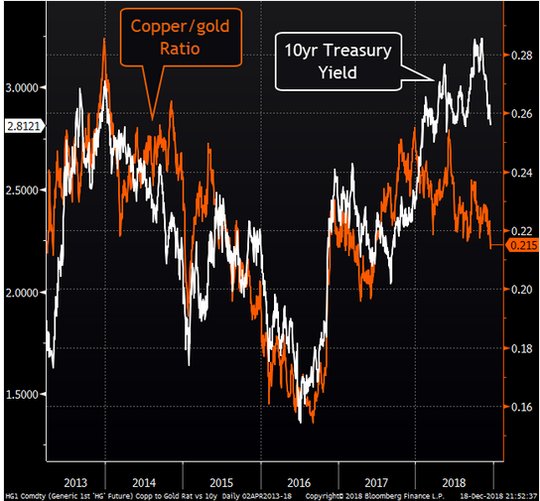
Question for the Day: Did Dr. Copper kill Santa Claus? The hope for a Santa Claus rally in US shares to bring them back to flat on the year rests on the FOMC and Chair Powell, but the market barometer of Copper is telling us that the hope is already dead. Copper is on track for the worst year since 2015 when China first imploded. Trade war tensions take much of the blame, but so too does housing. The fear of a US housing reversal has become a reality and it’s the same globally – just read about the worries in Hong Kong or Sydney or ongoing in Canada, UK, Europe. Today’s existing home sales will be watched closely and will be linked back to the FOMC rate decisions in 2018.
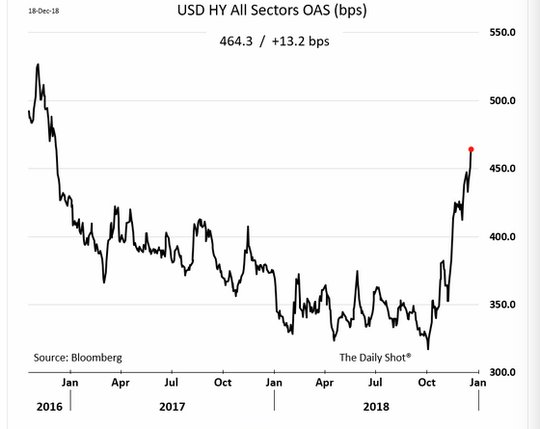
The link of all commodities to global growth expectations starts with oil, continues with industrial metals and shows up in the financial world in equities and in credit. The oil pain trade is clearly something that matters to credit widening in high yield bonds.
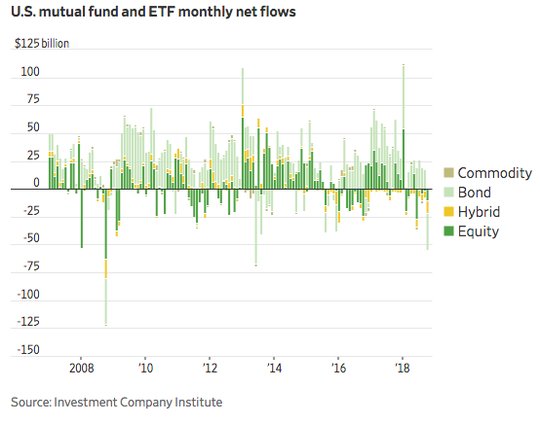
The biggest and perhaps most important problem for markets today is in trying to understand how the present outflows predict future ones. The present pain in all asset classes isn’t as extraordinary as in other times – but commodity pain does lead and matter. Perhaps this Dr. Copper indicator like that of inverted yield curves or consumer confidence isn’t able to perfectly predict all crisis, but in combination with those others its flashing real fear for markets ahead.
What Happened?
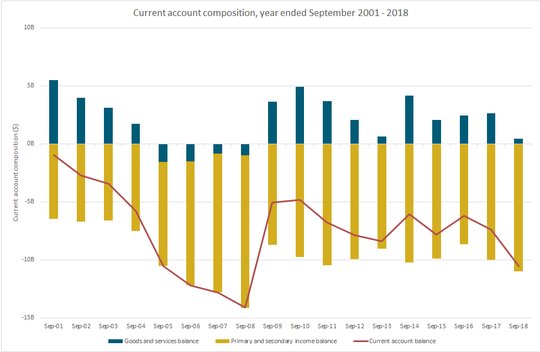
- New Zealand 3Q current account deficit NZ$6.15bn from NZ$5.16bn – more than NZ$5.85bn expected. The goods trade deficit widened to NZ$3.22bn up from NZ$2.15bn in 3Q2017 as exports rose 12.5% and imports jumped 18.1%. Primary incomes deficit narrowed to NZ$2.56bn from NZ$2.84bn and secondary narrowed as well to NZ$70mn from NZ$130mn. The GDP ratio for the C/A was unchanged at -3.6% - down from the 7.8% peak from the great recession but worse than -3.3% expected.
- Australia November Westpac-MI LEI fell 0.1% after +0.1% - weaker than 0.1% gain expected - however the 6-month y/y growth rose 0.43%from 0.1%. Seven of 8 components drove the gains with dwelling approvals, hours worked and unemployment expectations key drivers. The growth rate in 2H2018 remains lower than in 1H from 3.8% to 2%. The 2019 outlook is expected to slow to 2.6% from 3% in 2018.
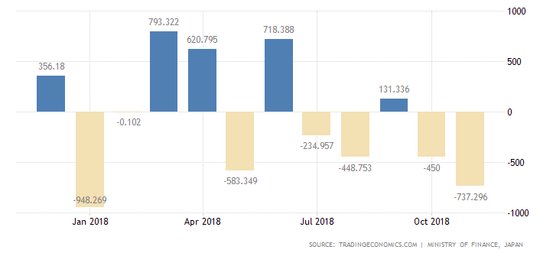
- Japan November Trade deficit Y737.3bn after Y449bn - worse than Y450bn expected. Exports rose just 0.1% to Y6.927trn after 8.2% - less than the 1.8% rise expected. Imports rose 12.5% to Y7.664trn after 19.9% - more than the 11.5% expected. Exports to China narrowed to 0.4% while to the US 1.6%. The ytd Japan trade deficit is Y1.14trn compared to Y2.4trn surplus for same period in 2017.
- German November PPI up 0.1% m/m, 3.3% y/y after +0.3% m/m, 3.3% y/y – more than the -0.1% m/m, 3.2% y/y expected. Energy rose 8.9% with gasoline up 19%, NatGas up 8.5% and electricity up 8.3%. Intermediate goods rose 2.4%, capital goods up 1.5% and durable consumer goods up 1.8% while perishables rose 0.4% - all y/y.
- Sweden December business confidence 104.1 from 104.6 – weaker than 104.7 expected. November revised lower from 104.8. The consumer confidence fell to 96.4 from revised 96.8 (was 97.5 preliminary) – also lower than 99 expected. The consumer inflation expecations rose to 3.4% from 3.3% - worse than the 3.2% expected.
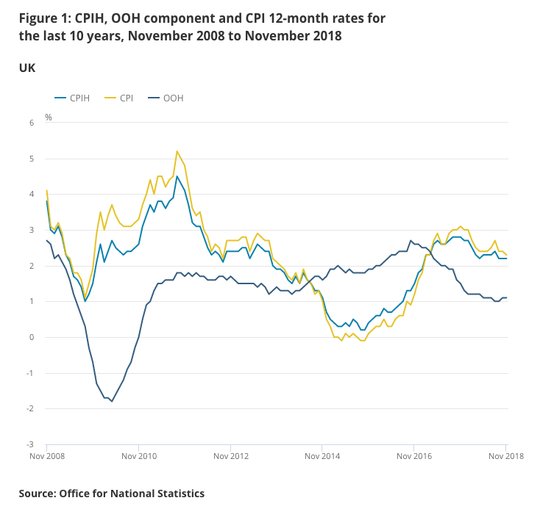
- UK November CPI 0.2% m/m, 2.3% y/y after 0.1% m/m, 2.4% y/y – as expected. The CPI core slows to 1.8% y/y from 1.9% y/y also in line with forecasts. The CPIH rate was unchanged at 2.2% y/y. The RPI slows to 0% m/m, 3.2% y/y from 3.3% y/y. The biggest drop in prices was linked to petrol, hobby/toys and some cultural services while rises were seen in tobacco and some accommodations.
- UK November PPI output rose 0.2% m/m, 3.1% y/y after 0.3% m/m, 3.3% y/y – more than the -0.1% m/m, 2.9% y/y expected. The core output PPI slows to 2.4% from revised 2.5% y/y (was 2.4%) – also more than 2.3% y/y expected. The input PPI slows to -2.3% m/m, 5.6% y/y after +0.8% m/m, 10.3% y/y – still more than the -3% m/m, +4.6% y/y expected – all mostly linked to crude oil price swings.
- UK December CBI industrial trends orders slow to 8 from 10 – better than 6 expected. This is above the long-term -13% average. Export orders were +14% - also better than -17% average and best since January. Output rose in 15 of 17 sub-sectors with food/drink leading, along with mechanical engineering and chemicals. The past 3M output was up 23% - better than 4% average – and up from 18% in November. Output expectations 3M are at 14%.
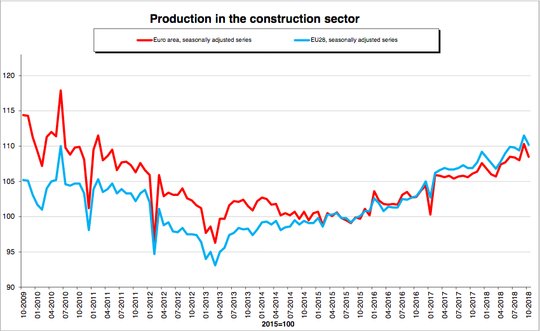
- Eurozone October construction output down 1.6% m/m, +1.8% y/y after revised 2.1% m/m, 4.8% y/y - less than the 2.9% y/y gain expected. September revised higher from 4.6% y/y. On the month, civil engineering fell 1.3% and building fell 1.9%. Biggest drops were in France -5.9%, Italy -1.6%.
Market Recap:
Equities: The US S&P500 futures are up 0.85% after a 0.01% gain yesterday. The Stoxx Europe 600 is up 0.5% with steady gains from the open. The MSCI Asia Pacific was flat with Japan and China dragging down regional gains with focus on technology.
- Japan Nikkei off 0.60% to 20,987.92
- Korea Kospi up 0.81% to 2,078.84
- Hong Kong Hang Seng up 0.20% to 25,865.39
- China Shanghai Composite off 1.05% to 2,549.56
- Australia ASX off 0.21% to 5,650.00
- India NSE50 up 0.54% to 10,967.30
- UK FTSE so far up 0.9% to 6,763
- German DAX so far up 0.65% to 10,812
- French CAC40 so far up 0.65% to 4,785
- Italian FTSE so far
Fixed Income: Big waiting game for FOMC now with little but periphery and Italy EU budget deal driving. Italy 10Y BTP yields off 16bps to 2.78% while German Bunds are flat at 0.24%, French OATs off 1bps to 0.70%, Spain off 1bps to 1.37%, Portugal off 1bps to 1.63% and Greece off 9bps to 4.30%.
- US Bonds sideways into FOMC– 2Y flat at 2.65%, 5Y flat at 2.65%, 10Y flat at 2.82%, 30Y flat at 3.07%.
- Japan JGBs steady with curve flatter– 2Y up 1bps to -0.15%, 5Y up 1bps to -0.14%, 10Y up 1bps to 0.04% (after trading to 0.02%). 30Y flat at 0.76%.
- Australian bonds extend rally in catch-up to US– 3Y off 1bps to 1.92%, 10Y off 2bps to 2.40%.
- China bonds rally with focus on year-end/equities –2Y flat at 2.81%, 5Y off 4bps to 3.06%, 10Y off 6bps to 3.38%. This follows the return of PBOC liquidity injections after 36-days of doing nothing.
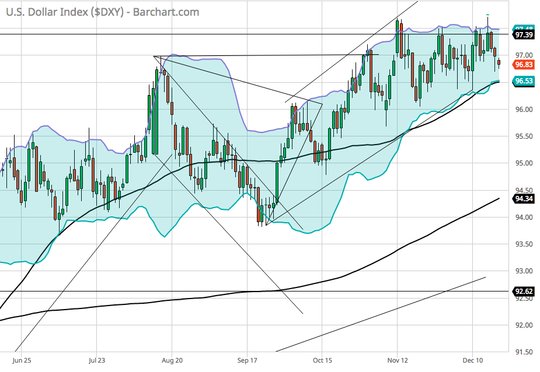
Foreign Exchange: The US dollar index is off 0.15% to 96.82 with focus on 96.50 and 95.75 next. In EM – ZAR up 0.4% to 14.264, RUB off 0.1% to 67.47, KRW up 0.1% to 1125.50, INR up 0.55% to 70.227.
- EUR: 1.1400 up 0.3%. Range 1.1359-1.1414 with 1.1420-50 next and 1.13-1.15 key for FOMC.
- JPY: 112.35 off 0.15%. Range 112.19-112.61 with 112 the key pivot for 110.80 but rates/risk the drivers. EUR/JPY 128.05 up 0.15%.
- GBP: 1.2640 flat. Range 1.2631-1.2679 with 1.25-1.28 holding pattern with Brexit/BOE still key. EUR/GBP .9020 up 0.35% - all about no-deal Brexit fears and ECB vs BOE next.
- AUD: .7190 up 0.15%. Range .7174-.7201 with USD weakness more than A$ strength key .7150-.7280 hot spots. NZD .6854 up 0.25% with .6880 pivotal.
- CAD: 1.3435 off 0.2%. Range 1.3434-1.3483 with 1.35 the big top to watch into FOMC and data. 1.3350 base building.
- CHF: .9935 up 0.1%. Range .9911-.9942 with focus on .9880-1.000.
- CNY: 6.8980 up 0.1%. Focus remains on 6.88-6.92 with no news on trade talks or economic meetings.
Commodities: Oil up, Gold up, Copper up 0.6% to $2.7305.
- Oil: $46.38 up 0.3%.Range $45.93-$46.66 with $45.50 and $46.80 key today into EIA and Fed. Brent up 0.2% to $56.67 with $55-$60 the big picture.
- Gold: $1251.90 off 0.15%.Range $1250.60-$1255.30 with focus on $1250 as the pivot and USD with FOMC key event. Silver flat at $14.72 with $14.79 highs. Platinum off 0.2% to $793.30 with $790 base building. Palladium up 0.45% to $1184.70.
Conclusions: Is Copper/Gold telling us something? The rise in gold in the last month and the drop in copper is interesting when you overlay it with US 10-year Treasury yields. The chart tells us that the FOMC would be wise to hold today and sound hawkish. What they should do and actually do often is very different and trading on them usually ends badly. The question for markets is whether the FOMC or the US Treasury or other central banks are going to use such correlations. The work done since the crisis in 2008 has led to a lot of new work – as this press release from MITRE yesterday shows – figuring out the next vulnerability matters.
View TrackResearch.com, the global marketplace for stock, commodity and macro ideas here.


