
Market Signals Strength Long-Term: Weekly Nifty 9
Welcome to another trading week!
Research Report Excerpts #1
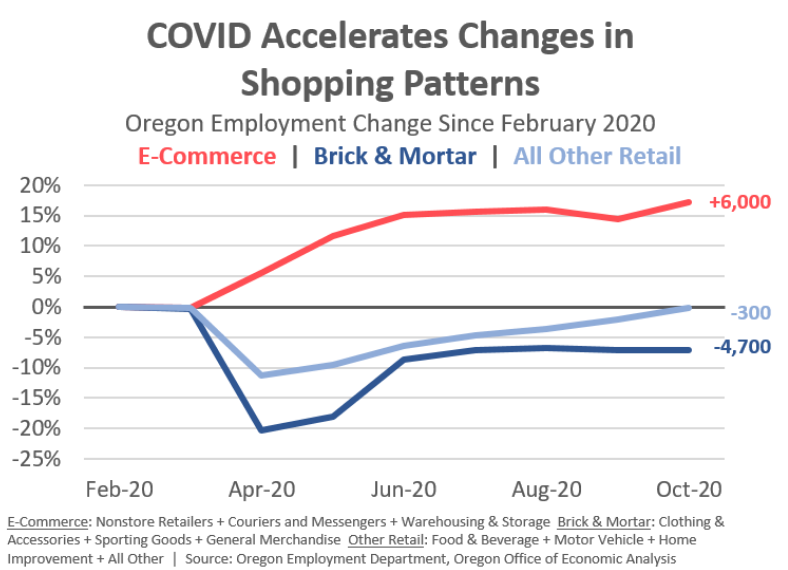
According to new data from IBM’s U.S. Retail Index, the pandemic has accelerated the shift away from physical stores to digital shopping by roughly five years. Department stores, as a result, are seeing significant declines. In the first quarter of 2020, department store sales and those from other “non-essential” retailers declined by 25 percent. This grew to a 75% decline in the second quarter. The report indicates that department store sales are expected to decline by over 60% for the full year. Meanwhile, e-commerce is projected to grow by nearly 20% in 2020.
Research Report Excerpts #2
The acquisition of BA shares a month ago has worked out famously for Finom Group members, as we have discussed and followed the trend higher in our daily, live Trading Room. I believe the opportunity highlighted in October for shares of CAT are similar to that in shares of BA. Let’s look at the chart as of Friday’s close.
(Click on image to enlarge)
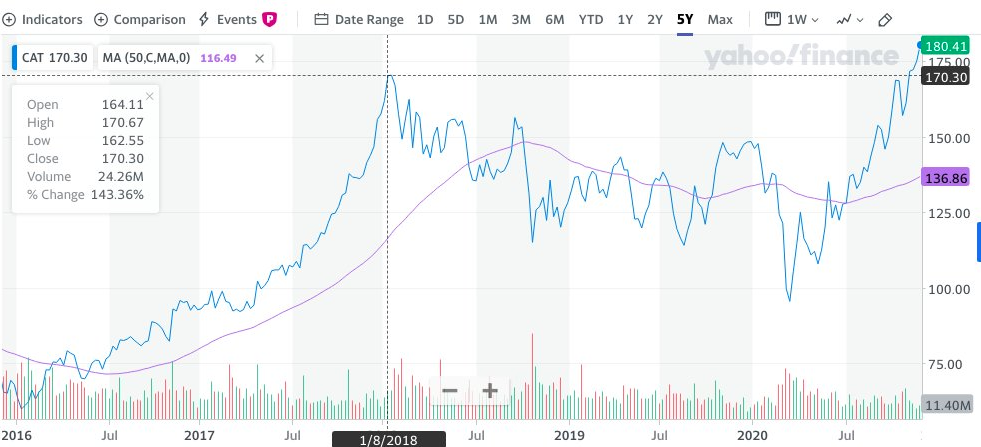
Caterpillar shares have suffered through a long bout of consolidation. The former peak was way back in January of 2018, and before the trade war with China commenced.
Research Report Excerpts #3
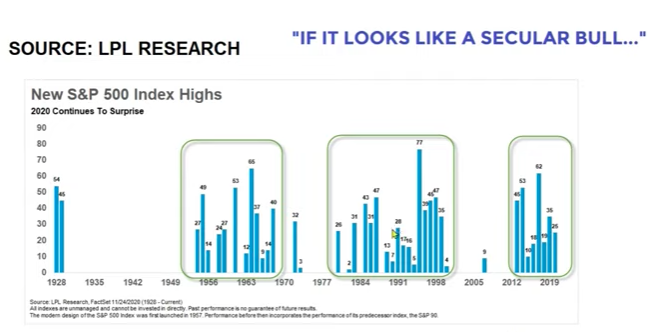
New highs in the market tend to cluster over a span of many years, more than a decade and they verify the market regime. Since 2013, the S&P 500 has been making new all-time highs after making only 1 new high from 2000-2007. The takeaway from this clustering of market highs is indicative of a secular bull market, and one that likely has legs well into the latter part of the decade.”
Research Report Excerpts #4
(Click on image to enlarge)
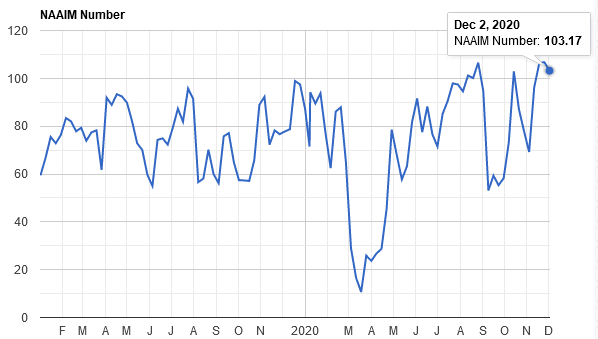
I think this is a point that many investors and market watchers often miss. Leverage and sentiment indicators can relieve their extremes, but they are not always a 1:1 correlation with price action. I am not discounting that the probabilities of a drawdown aren’t high, I am simply offering the greatest usage of these types of correlations are best used with respect to investor expectations. For those who sold the S&P 500 two weeks ago, or hedged, when NAAIM was over 106, I would assert that the simpler and more productive exercise was, again, searching out the next outperforming stock and remaining long the market.
Research Report Excerpts #5
(Click on image to enlarge)
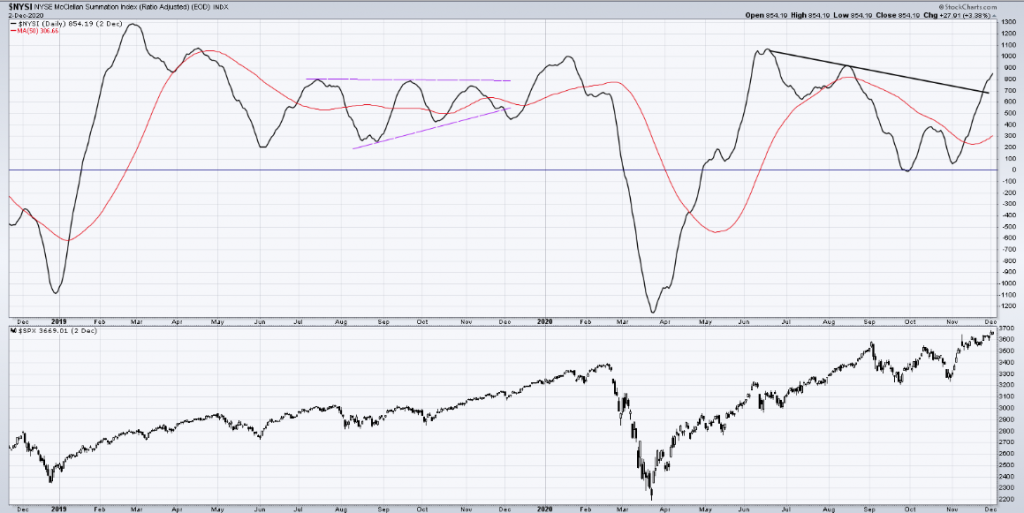
The McClellan Summation Index is a long-term version of the McClellan Oscillator, which is a market breadth indicator based on stock advances and declines. Sherman and Marian McClellan created and developed the McClellan Summation Index. Interpretation is similar to that of the McClellan Oscillator, except that it is more suited to intermediate to major trends and related reversals. Some McClellan Summation Index rules of thumb include the following:
- Look for major bottoms below -1,300
- Look for major tops with a divergence above +1,600
- The beginning of large bull runs are sometimes indicated when the McClellan Summation Index crosses above +1,900 after moving +3,600 points from its prior low (e.g., the McClellan Summation Index moves from -1,550 to +1,950.
The NYSI breaking out and above the trend line is a strong, positive long-term development in my opinion. Furthermore, recognize that this is a BREADTH INDICATOR! What do we know about breadth? Breadth leads price!
Research Report Excerpts #6
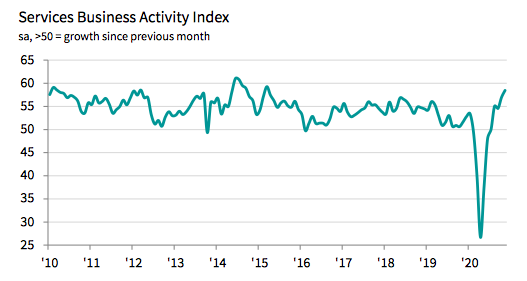
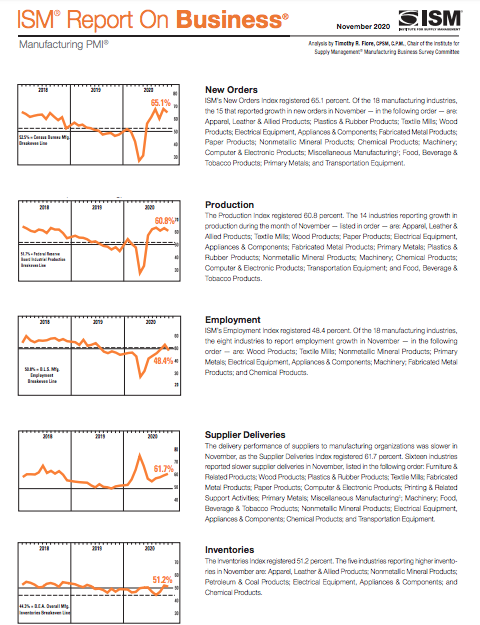
In somewhat of a surprise, the Markit Service PMI reading rose more sharply than expected, even with regional economic restrictions continuing to roll-out across the country since November. The seasonally adjusted final IHS Markit U.S. Services PMI Business Activity Index registered 58.4 in November, up from 56.9 in October. The latest reading was higher than the earlier “flash” estimate (57.7) and signaled the sharpest expansion for over five-and-a-half years. Growth of business activity was often linked to greater new order inflows and the release of pent-up demand, as clients became less hesitant to make purchases.
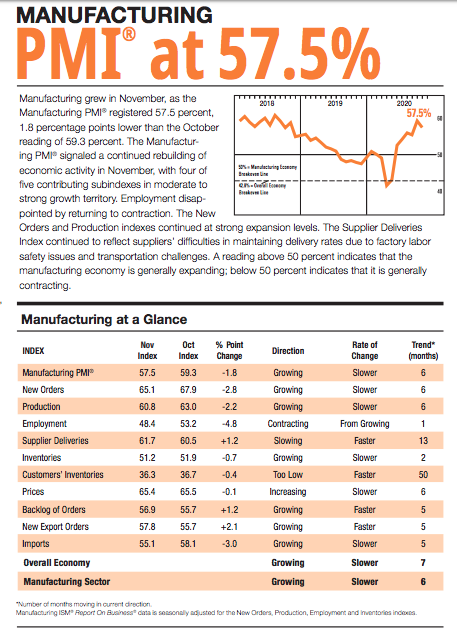
The U.S. ISM Manufacturing index dropped a bit to 57.5 from a lofty two-year high of 59.3 in October, but a lower 55.4 in September still leaves the index fluctuating around its highest levels since August of 2018. The index has been deep in the expansion territory since June.
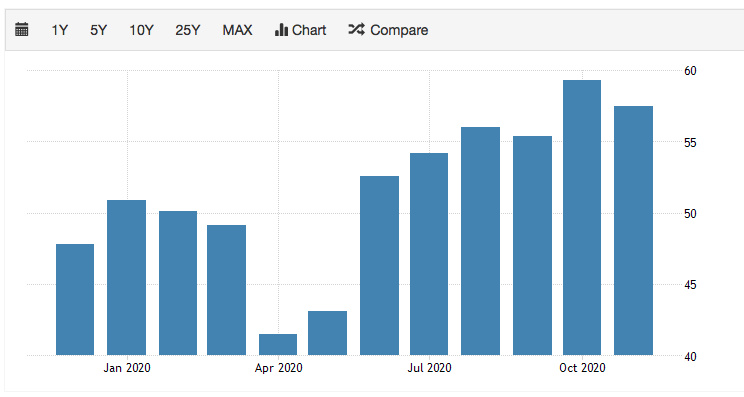
The sentiment indicators remain strong despite a November moderation with renewed coronavirus cases, as output rises in the face of plunging inventories and rising sales.
(Click on image to enlarge)
Research Report Excerpts #7
“The first quarter of the 1st year of a Presidency tends to be challenging.”
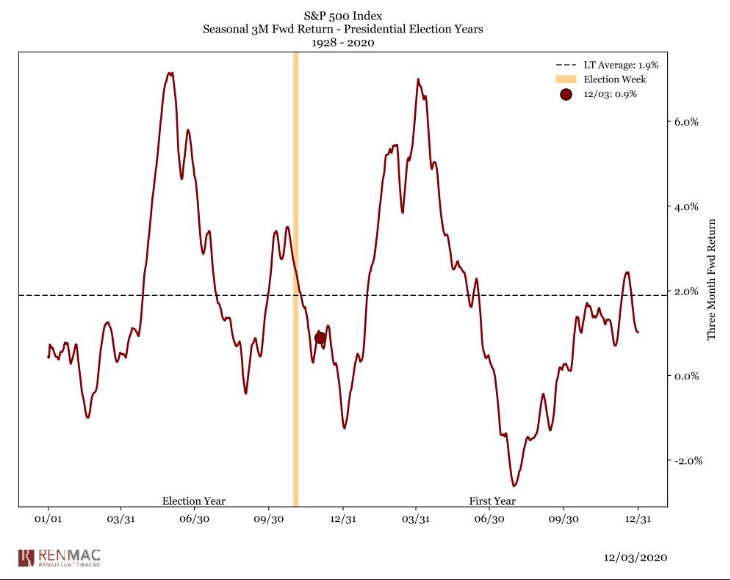
Keeping in mind that the data is the data and we can’t argue with the facts; we can look more deeply into the data to find the alpha, the potential outperformance. The RenMac data goes all the way back to 1928, which in my opinion proves less useful than a study dating back to the post-WWII period. Going back to that time period, indeed, the Q1 following an election year does deliver a negative return on average. But here is what I also found:
- Number of negative Q1 returns going back to 1976 is 3, after election year.
- Outside of 2009 (GFC), and 2001 (dotcom) only 1977 Q1 was negative.
- Q1 positive after election year on average even when including 2009/2001.
Research Report Excerpts #8
If we fast-forward to the latest FY2020 and FY2021 consensus analysts’ estimate we can see that there has been a dramatic rise, even out into 2022:
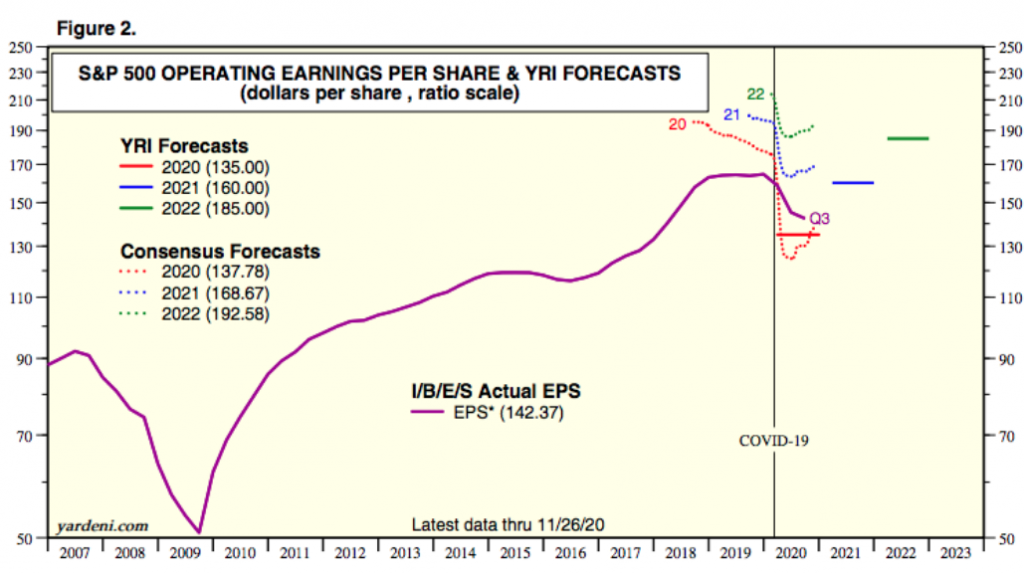
The market’s relentless rally since the election week has forecasted the likelihood of better than anticipated earnings. As I’ve offered in the past, the market is not usually found in error shy of Fed missteps and/or an exogenous event i.e. the tightening cycle of 2018 and COVID-19 in 2020. Furthermore, don’t be surprised if Q4 2020 earnings season culminates with FY2020 EPS coming in at the $140s per share level.
Research Report Excerpts #9
Now here is the view from the 30,000 foot level, so to speak. A sign of broad breadth: Large-caps, mid-caps and small-caps have staged upside breakouts to new highs.
(Click on image to enlarge)
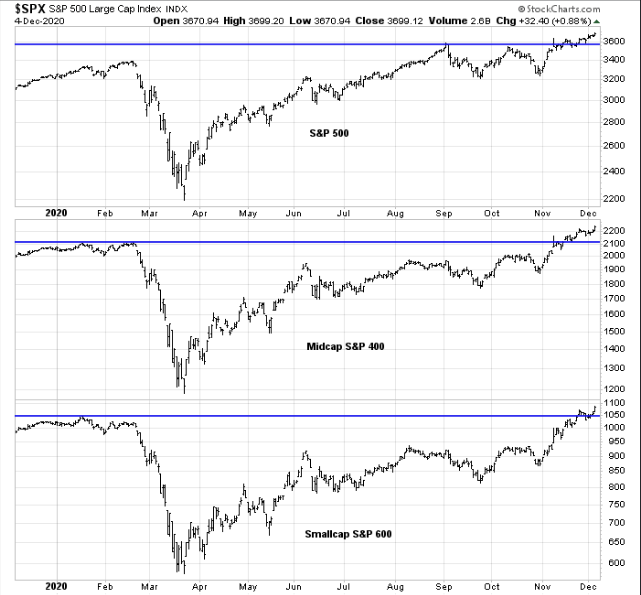
Breadth leads price and while we might be expecting some turbulence near-term, the long-term breadth strength suggests higher prices ahead in 2021.
Disclaimer: The risk of loss in stock, stock/options, futures, futures/options, and forex trading is substantial, and site visitors and subscribers should consider whether trading these markets ...
more

