
Market Setting Up For A Bullish Signal
- SPX Monitoring purposes; Sold SPX on 2/12/19 at 2744.73 gain 1.36%; long 2707.89 on 2-8-19.
- Monitoring purposes GOLD: Long GDX on 1/29/19 at 21.96.
- Long Term Trend SPX monitor purposes; Long SPX on 10-19-18 at 2767.78
(Click on image to enlarge)
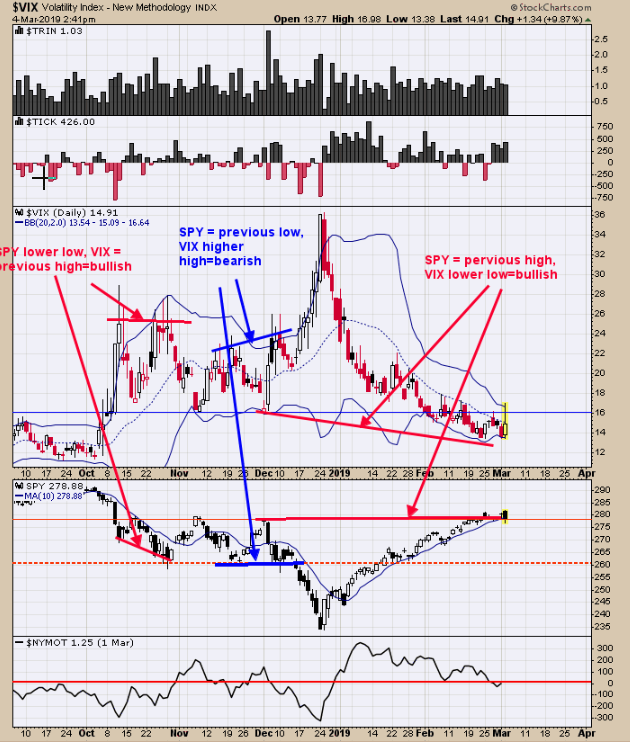
Above is the daily VIX.SPY is in an uptrend when VIX is below +16. Though SPY pulled back today the VIX remained below +16, closing at 14.57. SPY is running into resistance near the 280 level which is the November and December 2018 highs. Next Week is Option Expiration week which normally has a bullish bias and the week before (this week) can produce short term whipsaws. The VIX trades opposite of SPY. The VIX has made lower lows below the November and December highs suggesting at some point the SPY will break above the November, December highs (280 SPY range). A bullish setup could be triggered in the coming days.
(Click on image to enlarge)
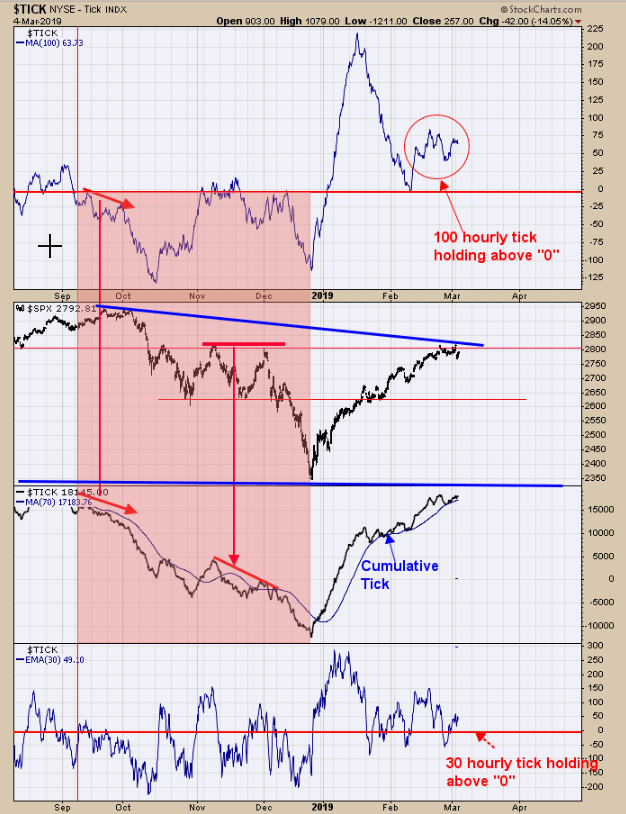
The market could be setting up for a bullish signal. SPY was down .37% today and the 100 hourly and 30 hourly tick remained above “0” and a bullish sign. The middle window is the Cumulative hourly tick which remains above its 70 period moving average also bullish. The Dow was up 9 weeks in a row going into 2/22/19 and the week after is up 44% of the time with an average loss of .17% and this week its up 25% of the time with an average loss of .57%. Therefore the rest of the week may just be flat. With the VIX and the Ticks leaning bullish, expiration week could be positive. Like to see a rising TRIN reading to add power to the next rally which could develop in the coming days. Not showing a clear signal here but tick and VIX readings are showing a bullish bias.
(Click on image to enlarge)
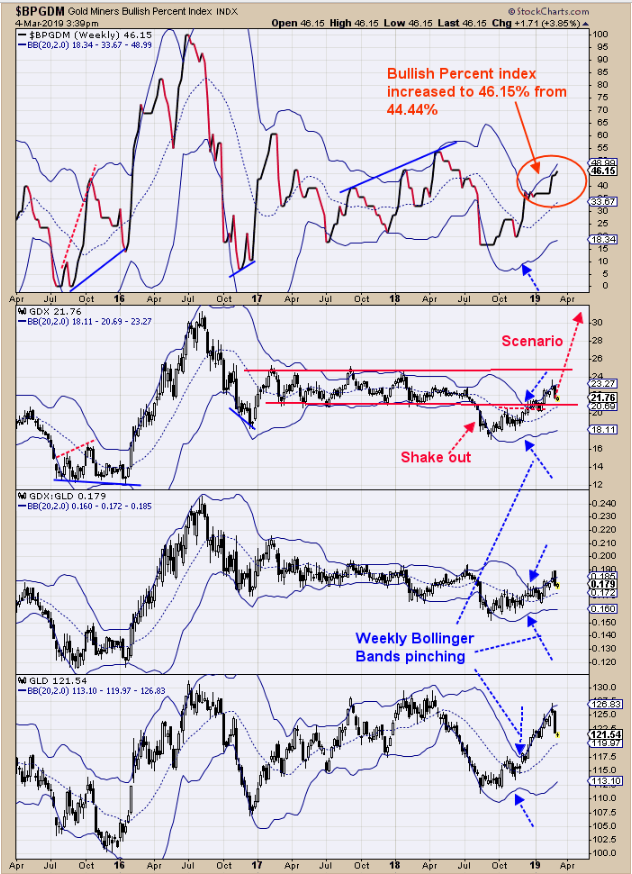
Bullish Percent Index for the Gold Miners index jumped to 46.15% of the stocks that are on Point and Figure buy signals up from last week of 44.44%; showing the market is getting stronger. And this happens when the market was down last week. The middle window is the daily GDX chart. Last July GDX fell below the lows of 2017 near 21.00.GDX has since rallied back and closed above 21.00 creating a bullish “Shakeout”.A “Shakeout” is a breakout to the downside that fails and suggests if a market can’t hold below the lows it will reverse and attempt to take them out the previous highs. The previous highs in this example is the trend line near the 25.00 range and will be an upside target for short term. However, we believe the higher target near the July 2017 high of 30.00 range is a more lightly target later this year. Long GDX on 1/29/19 at 21.97.
Disclaimer: Signals are provided as general information only and are not investment recommendations. You are responsible for your own investment decisions. Past performance does not guarantee future ...
more

