
Market Sentiment Has Improved; Q1 EPS Forecasts Still Fall
One of the issues with suggesting that the S&P 500 (SPX) overreacted to a growth slowdown in Q4 2018, is that is merely a human assessment, something that has an increasingly insignificant role in the equity markets. The equity markets are increasingly underpinned with programmed algorithms and found with less and less active fund managers. Combined factors only serve to enhance the “liquidity trap”. Just as I had characterized much of the selling pressure that occurred during Q4 2018 as algo-driven and found to be more of a technical liquidity event, the same can and is being offered for the current state of the market, as it relentlessly recovers through Q1 2019.
“A shift from “slower” human market makers, who often rely on valuations, to faster programmatic liquidity that rely on volatility measures to determine risk-taking and position sizing, can strengthen momentum and reduce day-to-day price swings, according to Kolanovic. However, it increases the risk of market disruptions such as that seen in October.
During times of high volatility, the VIX starts to dwarf other factors as a driver of market liquidity, according to Kolanovic. Recently up to around 80 percent of liquidity variations were explained by the volatility gauge.” (See chart below from JPM)

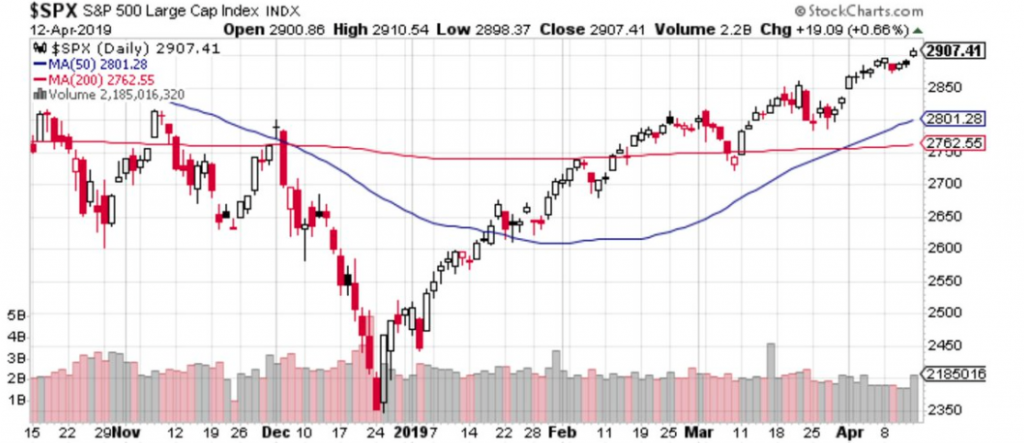
What the chart above outlines is that absent active managers and/or value investors, fear begets more fear during bouts of volatility. Additionally, programmed trading highlights a shift in gamma positioning, deepening a market selloff. There are limited active, value investors willing or present to step into the market and execute on what is perceived value. The algorithms are left to their own devices and tethered design. The tethered design or program is often technical or keyword correlated. They are level seeking in most cases and just as relentless to the upside as they are to the downside and for such reasons, commodity trading advisors (CTA)’s generally avoid market positioning/participation… until a reversal of trend is presented. Even then, CTAs, hedge funds and the like choose to tiptoe into the market with rather light positioning. The psychological damage of a market slide can be lasting, daunting. With that being said here is a snapshot of where the S&P 500 currently rests heading into a 4-day trading week.
With a key premise of this weeks report in the rear view mirror, erroneously removing the context and causation of the Q4 2018 drop in the S&P 500 from our consideration, I am freed up to focus on other topics. Our first topic purposefully piggybacks on the discussion of market volatility… and why?
Market Volatility Review
There is so much… ok, that’s a bit of hyperbole, but there is a lot of misinformation out there in the public about the present state of market volatility as defined through the volatility complex and its prime constituent, the VIX . To state it very plainly, investors and market participants are looking at the following chart and failing to analyze it with respect to many other variables at play.
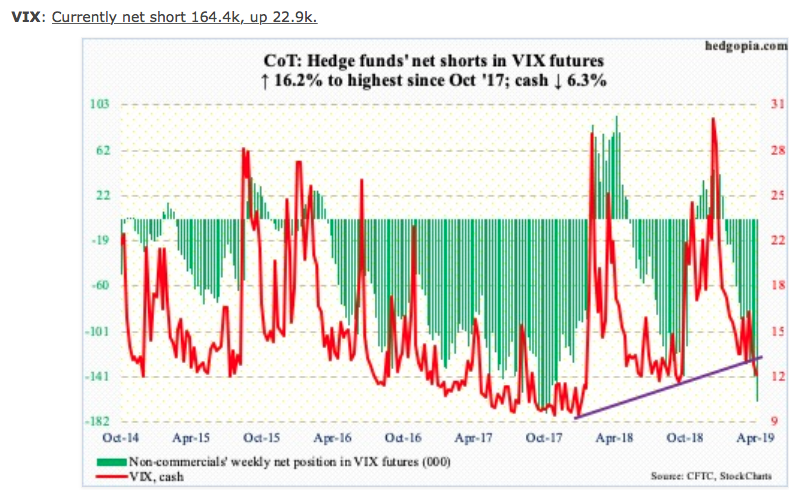
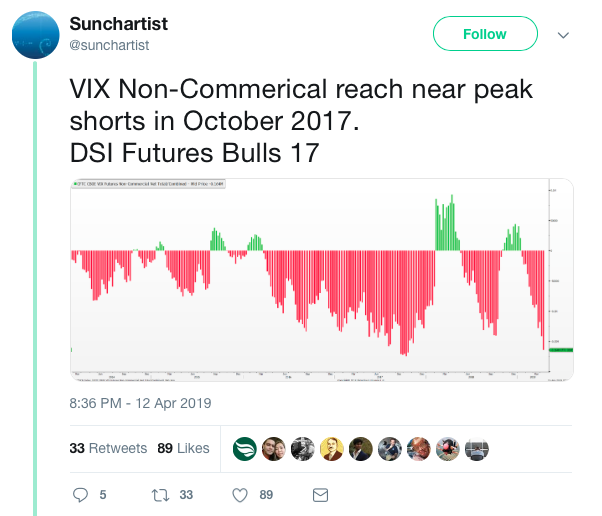
“Non-commercials continue to push. They are now merely 10.3k contracts from record net shorts of October 2017. Holdings have now surpassed last October’s levels, right before a surge in the cash (12.01). Concurrently, the contango in the VXST-VIX-VXV-VXMT curve this week went deeper into the negative territory, with a spread of minus 6.3. Sooner or later, these metrics get unwound. It is just a matter of when – and whether or not VIX continues lower before unwinding begins.”
On the surface, the chart of non-commercial/hedge fund net shorts in VIX futures looks rather ominous, right? Answer: yes it does! But it lacks context as well as the necessary convexity to produce an event on the magnitude of February 2018/Volmageddon. What led to the current non-commercial speculative positioning actually had its roots planted in late January 2019. Again, for simplicity sake, the so-called smart money didn’t believe in the market rally through January and felt its legs would be cut out from underneath it very soon…back in January!
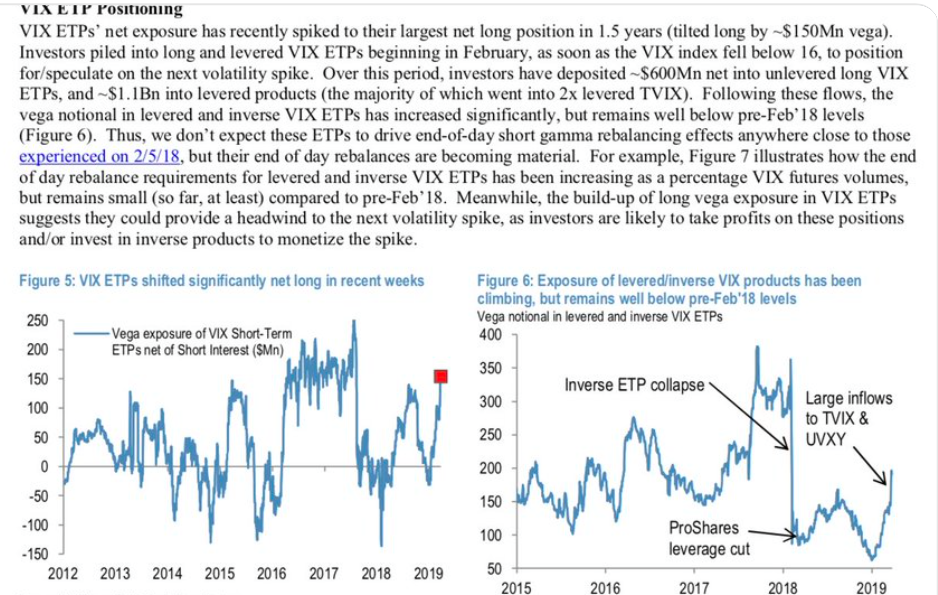
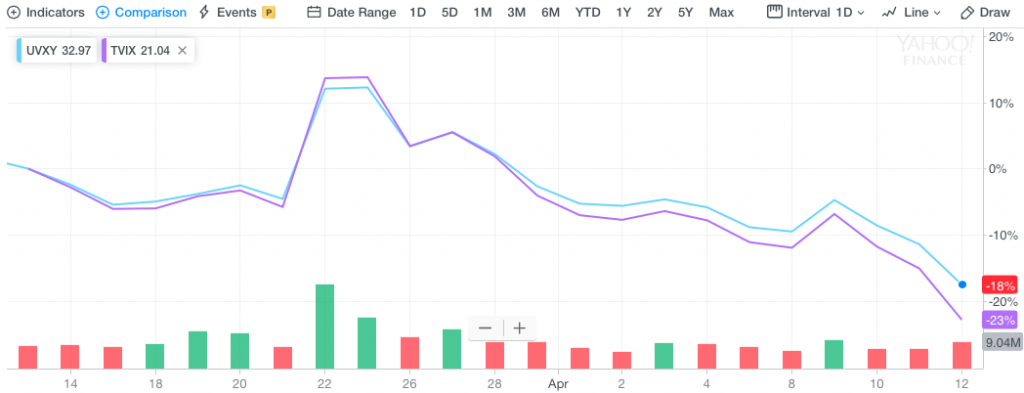
As shown in the notes and charts above from J.P. Morgan Chase back in early February, VIX ETP’s net exposure had spiked to their largest net long positions in 1.5 years. This created an extreme net long Vega paradigm or low boundary convexity regime. Much of the flows went into TVIX, which is a 2X leveraged instrument, signaling the conviction for which the volatility targeting funds were positioned. Based on the positioning, the VIX-ETP/TVIX also saw a magnificent spike in share creation/outstanding (SO). (See chart below). While many thought this to signify the artificial share creation to offset option positioning short the VIX-ETP, it proved quite the contrary.
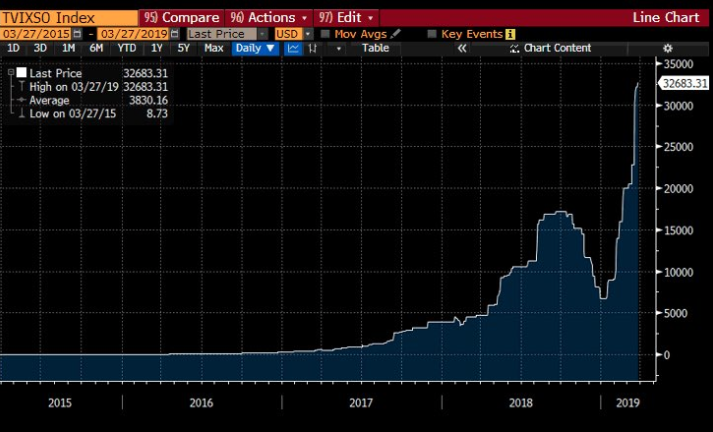
How do we know this simply based on the notes provided by J.P. Morgan and the SO? We also can look at the Short Interest (SI) in shares of TVIX. (See chart below)

As I've mentioned in previous reports, short interest is just 56% (up from previously reported 48%) of market cap as compared to short interest averaging above 100% of market cap in the years before XIV implosion. Plainly speaking and this includes all other VIX-ETPs, levered and unlevered, the short interest is simply too light to produce another Volmageddon.
In terms of the Vega imbalance at the commercial level being heavily tilted long when compared to the short Vega, (See chart below from Matt Thompson), this also provides a buffer against all volatility spikes when combined with the existing open interest. Essentially there is “an injured dog at the end of the leash, unlikely to bolt after the rabbit”.
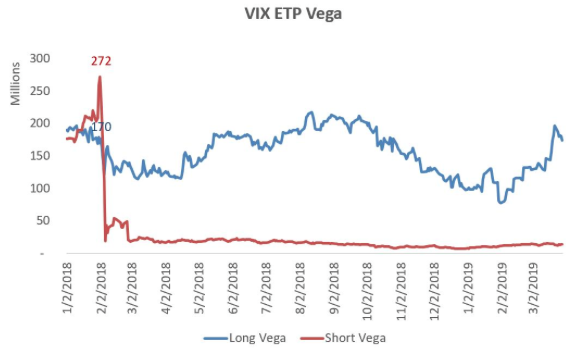
Because long Vega is much larger than short Vega, there is little positive feedback offered in the positioning that is already heavily underwater and therefore the dog is unlikely to chase the rabbit. There would likely be offloading of these long positions closer to net-even/profit once an uptick in implied volatility is realized, as the impetus to hold such positions thereafter is found wanting for greater short interest. Below is a longer-term chart of VIX ETP Long/Short Vega ratio. Keep in mind that in 2017, TVIX reverse split, which isn’t accounted for in the chart. Nonetheless, one can see that the ratio is more tilted long and at levels seen back in 2013.

And that is where our short interest in VIX futures is found relevant with regards to the latest COT update of non-commercial positioning. Remember, what most people are focused on is non-commercial positioning.
They are missing the commercial positioning component for which to assess Vega, exposure and open interest. What Finom Group has always recommended and monitors is the combined positioning of commercial and non-commercial positioning so as to also be able to determine open interest. Below is a chart of VIX futures volume and open interest in the front 2 months futures contracts.
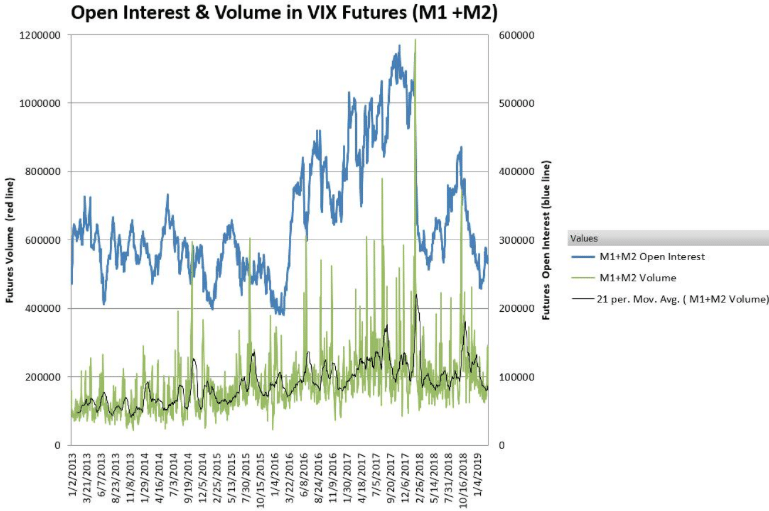
Based on what we can see and quantify, VIX futures of relevance at the front end of the VIX futures curve are running at 2015 levels; this is not anywhere near the open interest seen in October 2017 or leading up to the February 2018 VIX event. Lastly, we can review commercial and noncommercial combined positioning from the CFTC as shown below. This is updated as of 4/12/19.
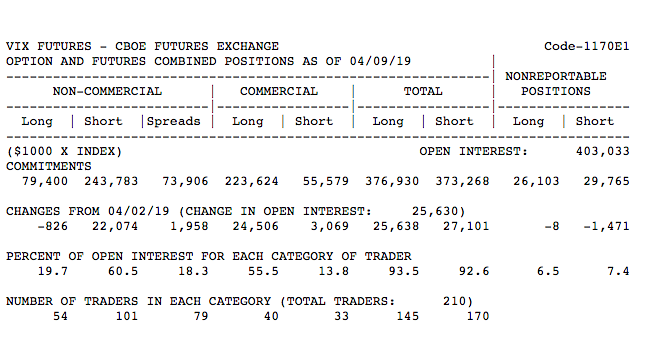
From the CFTC data above we can conclude that while non-commercial short positioning/exposure is high relative to long exposure, it’s quite the opposite in the commercial complex. Moreover, the short exposure in futures is the plausible byproduct of volatility targeting fund flows that previously demanded an increase in VIX-ETP shares outstanding. Most importantly and we can’t stress this enough, current positioning will likely cap volatility spikes as there is enough length in the leash/positioning long that will be incentivized to take profit WHEN volatility ticks up… But there is not enough short interest to drive large squeezes higher. Additionally, this does not insist a volatility spike can’t occur from an exogenous event and find market liquidity rapidly washed out of markets.
There is a great deal of calculus involved in quantifying implied volatility and thus drawing conclusions. The entirety of the VIX-complex is derivational in nature and defies a great many traditional analytical exercises/practices. One such practice I shy away from, which is also validated by within most Technical Analysis (TA) certification courses is the practice of TA within the VIX-complex and upon the VIX itself. The very nature of the VIX being a derivative of. SPX OTM option activity producing the oscillation of the index bears no need for TA. There’s an eventuality intrinsic to the VIX. Eventually, the VIX will spike, then decay and mean revert with time before eventually finding a new low reading. That new low reading can take decades, but it will occur.
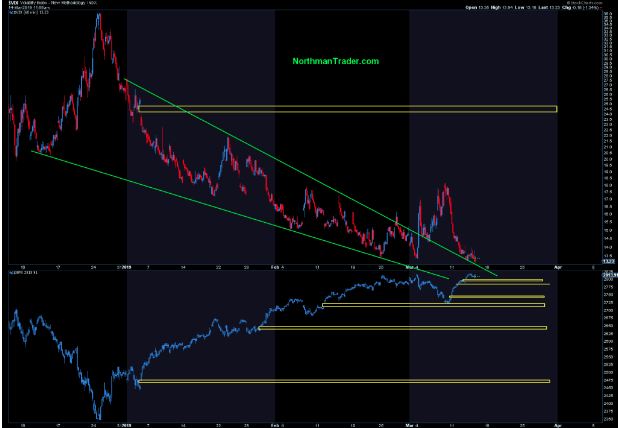
Nonetheless, TA is often used by market participants to mark the eventual rise in the VIX. Sven Henrich, a.k.a. Northman Trader recently fell prey to the fallacy of practicing TA on the VIX. In an article authored on March 15, 2019, (a month ago for which most positions who assumed a long VIX position would have taken a loss for most any instrument of choice) Henrich warned of a near-term VIX event. The effort was titled “Brace yourself for the coming spike in the VIX”.
“We saw one in 2015 following the August 2015 correction, and another big one in early 2018 following the February correction and, we just witnessed one again following the December lows, a pattern that produced a quick spike from 13.5 to 18 last week prior to this current options expiry week.
All of these tight wedges produce an eventual counterspike of size coming from overly compressed conditions.
One notable feature: When VIX gets crushed following spikes any gaps on the way down eventually get filled. All of them.
And so here we find ourselves with Thursday seeing the lowest VIX print of 2019:
So let’s quickly review Henrich’s quote above. Yes, there was a spike in VIX for that period ahead of options expiration week. BUT, that spike quickly evaporated within 2 trading days.
- How do you position ahead of such an event and to benefit directly within the volatility complex?
- Where does one enter and exit and with what variety of instruments?
- Based on how quickly and routinely volatility is shoveled out of the market after a spike, why would one position for it?
- Where would the confidence in positioning come from, not knowing when the volatility spike will end precisely?
- The gaps up in volatility are just as measurable as the gaps down after a spike.
In other words, what is Henrich really offering in his narrative given that positioning ahead of and for a VIX spike often proves negligible at best and a tax on portfolios at worst? It’s really a rhetorical question, as we know the only value in publishing such content is intrinsic. Based on the tenor of the article, it simply stokes fear in market participants who otherwise lack market experience. But let’s look at more of the narrative.
This week’s compression, while producing lower prices, appears to simply retest its broken trend line. Note also that VIX has a glaring open gap in the 24/25 area. The year is young still, and there is plenty of room to eventually fill this gap.
As Henrich mentioned earlier, gaps in the VIX are always filled; it’s just a matter of when. Which is why he also states, “While some gaps can stay open and unfilled for years this large number of open gaps are unlikely to remain unfilled for an extended period.” Nothing wrong with a little “CYA” right? Remember, this narrative from Henrich was written a month ago Monday. The exercise of discussing the eventuality factors of the VIX need no TA, they simply need a volatility targeting strategy and the existence of time. Since Henrich’s article, if one hedged their portfolio via the VIX-ETP complex, they would have entered a very painful trade and likely taken losses, otherwise known as a tax on one’s profits. It’s for this reason that the majority of time, the non-commercial net speculative futures positioning is net short. Most people simply wait out a volatility spike, roll positions and/or add more short-VOL positions as the VIX spikes. We know a VIX spike can’t last forever and the decay period can be extensive.
In no way, shape or form am I suggesting a VIX spike isn’t in the cards, but rather given the current gamma offloading, hedging with VIX-ETPs, spikes will be of lesser consequence and short-lived. This statement also presumes a larger spike, given the present implied volatility, but with quick reversion.
Shortened Trading Week
Next week is Good Friday and as such the stock market will be closed on Friday. Last week’s S&P 500 weekly expected move was a meager $31/points for which the index closed within the weekly expected move and after hitting a high point of roughly 2,911. That high-water mark went unnoticed by many, but it represents a key gravity point that found the index trading in and under the 2,911 level and before breaking to new highs in September 2018. So in falling back below 2,911 to end the week, we’ll have to keep this gravity point in mind with bank earnings rolling out in the week ahead.
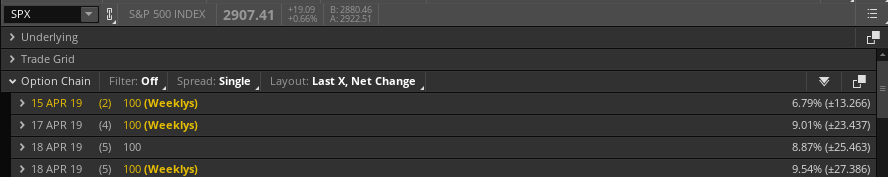
As shown in the screenshot above, for the shortened trading week and with volatility hitting it’s lowest level of the year on Friday, the weekly expected move has decreased. This coming week, options are pricing in a weekly expected move of just $27/points. We’re not sure that’s not going to be eclipsed in one direction or the other with a majority of banks reporting and Wells Fargo (WFC) not looking so hot after reducing guidance. Certainly, J.P. Morgan Chase’s results were strong and handily beat analysts’ estimates, but best of breed companies/stocks should produce such a performance.
It’s easy to declare that the YTD market rally remains absent positive fund flows and with the usual hedge fund underperformance, however, it’s not so easy to qualify when that paradigm will shift. About $90 billion has left equity funds this year, including $2.6 billion of outflows in the week through April 10, according to a Bank of America Corp. report that cited EPFR Global data.
Fast-money exposure to U.S. equities has plunged to the lowest since 2013, according to an estimate of the portion of their returns attributable to the S&P 500 Index. Other data show the ratio of bullish bets to bearish ones near the lowest in more than a year. CTAs and trend targeting funds are still on the sidelines and holding firm to their “bets”.
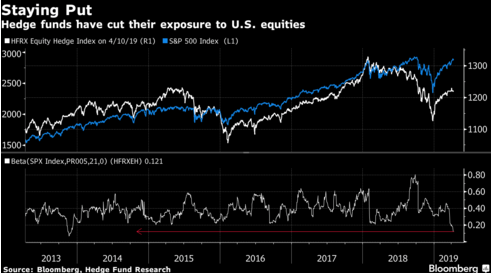
“It’s a sign that hedge funds remain steadfast in their refusal to chase the rising market as they opt for nimbler trades -- rather than a warning that the smart money is aggressively selling into the rally, according to Nomura’s quantitative strategist Masanari Takada.
Others such as risk-parity funds, which adjust their asset allocations based on price swings, have slowed their equity buying, according to Nomura. Commodity trading advisers -- trend-following quants -- will likely stay on the sidelines until the S&P 500 is safely above 2,900, a level the index breached today for the first time since October.”
Market sentiment has dramatically improved through the Q1 2019 period and into the first 2 trading weeks of April. Remember, April tends to be the best month of the year for the S&P 500. What else might investors be asking as the market trek’s higher without positive fund flows and seemingly stubborn CTAs and hedge funds whom are willing to wait this rally out? How’s market sentiment? Goldman Sachs (GS) sentiment indicator is also at extreme highs.
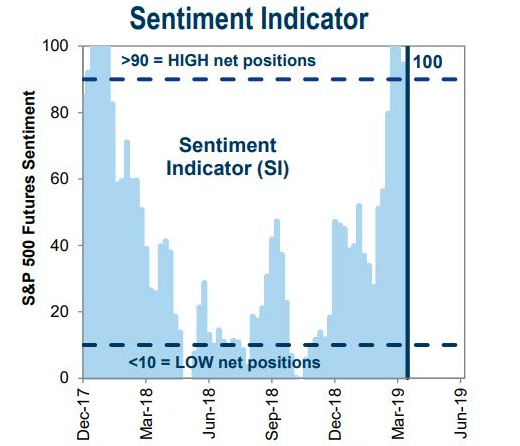
This Goldman Sachs Sentiment Indicator says that an extremely positive reading +90 suggests the S&P 500 has a high probability of falling by ~3% during the following 6 weeks. When coupled with the extreme breadth thrust that has excluded a 3% decline during the current market rally, this combines to further validate the bearish slant when it comes to the overall risk/reward equation presently, given current S&P 500 levels. Keep in mind, the all-time high is only 1% away folks, that’s 1% upside probability near-term juxtaposed with many other variables at play that could elicit a market pullback. Weigh your risk appetite for the next 30-day period and review your current positions for the purpose of risk management.
Spotting fear or complacency is easy, but spotting tops and bottoms are extremely difficult. In congruence with the latest GS Sentiment Indicator reading, the latest E-Trade StreetWise study showed improved bullish sentiment among respondents.

- Bullish sentiment returns. Bullishness rose 12 percentage points since last quarter to once again represent the majority of investors at 58 percent.
- Investors believe there’s more room for the bull market to run. Two-thirds of investors say they think the bull market has a year or more to go (66%), up seven percentage points from last quarter.
- The majority gave the US economy a passing grade. Investors who gave the economy an “A” or “B” grade rose 9 percentage points this quarter, to 64%.
- Volatility concerns remain. Investors who believe volatility will stay the same was up by 8 percentage points from Q1.
“It’s been a great start to the year for the market,” said Mike Loewengart, VP of Investment Strategy at E*TRADE Financial. “While economic data has shown some slowing, many encouraging data points remain, particularly in the labor market. Investors have shown their resilience and, at least for now, seem to have shrugged off growth concerns from the Fed, as well as auxiliary geopolitical concerns from Brexit, Iran, and Latin America. Hopes of a trade deal with China spring eternal, and any clarity on that front could serve to further drive investor confidence.”
It’s clear that even with light market positioning and outflows, sentiment has improved, but only as of late. Are these the telltale signs of a near-term pullback? Sentiment indicators tend to be viewed as contrarian indicators after all.
Economic Data Improves
Just as the title of this segment suggests, economic data has improved, as the Q1 period turns a new quarter. From the previous weeks Nonfarm Payroll report to this past week’s Initial Jobless Claims, the economy is showing signs of having trough through Q1 and reemerging in Q2.
Some of the lesser valued economic data was released last week and mostly proved to meet economists’ forecast/expectations. (Table from MarketWatch)
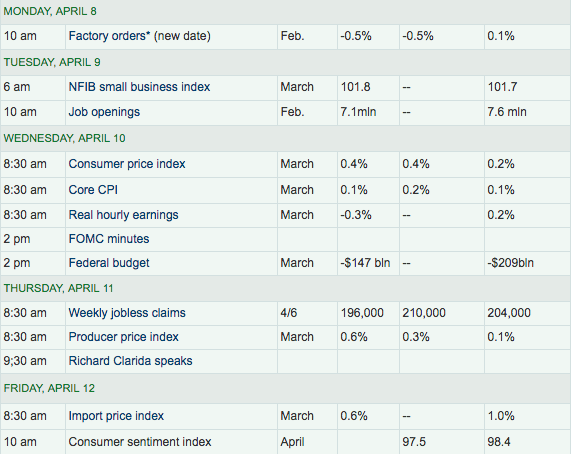
The JOLTS survey showed a decrease of nearly 500K, but came down from record levels and still remained above 7mm and remains at elevated levels. Core CPI cooled more than expected

Even when accounting for food and energy, CPI came in as expected and is proving out the trend of disinflation since the summer of 2018. And then Initial Jobless Claims hit their lowest levels since 1969…. again!
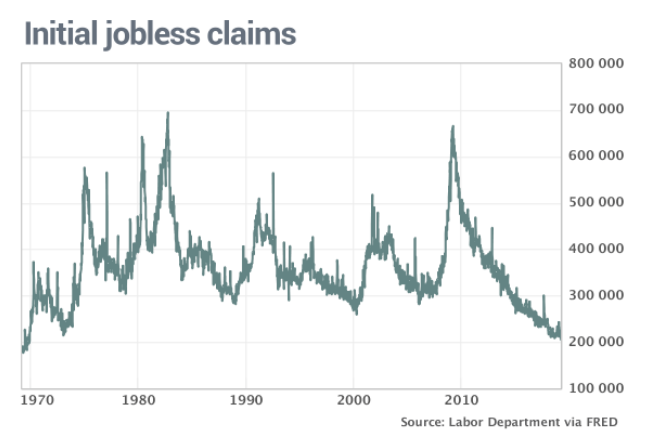
Jobless claims, a rough measure of layoffs, fell by 8,000 to 196,000 in the seven days ended April 6, the government said Thursday. Economists had been expecting a reading of 210,000. Jobless claims have fallen four weeks in a row to the lowest level in 50 years, just a few months after spiking to as high as 244,000. The more stable monthly average of claims, meanwhile, declined by 7,000 to 207,000. That was also the lowest mark since 1969.
Last week was a rather light week for economic data, but next week is anything but light. (Table from MarketWatch)

The week will not only begin with bank earnings on Monday but also the Empire State Manufacturing Index. The Beige Book will be released on Wednesday only to be followed by the all-too-important monthly retail sales and Philly Fed Index on Thursday. Recall the prior month’s Philly Fed Index had a strong uptick. Many market participants will desire to see some follow through in order to confirm the worst of the economic slowdown is in the rear view window.
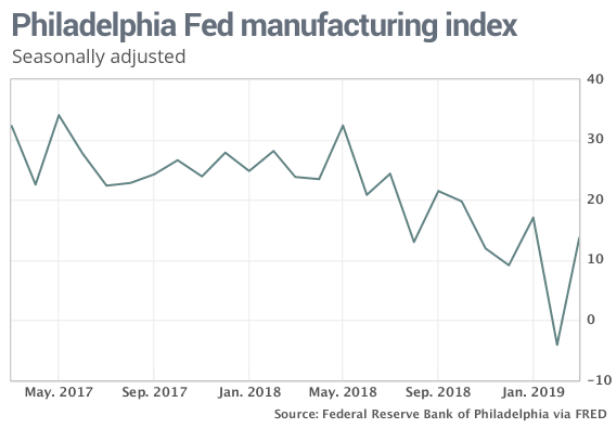
While the composite Philly Fed Index rose, some components within the index didn’t prove as favorable. The survey’s component on new orders increased only slightly to 1.9 in March from -2.4 in the prior month, which was the lowest figure since May 2016. Shipping in the region rebounded strongly into positive territory to 20 from -5.3 in February. The survey’s employment barometer slipped to 9.6 in March from 14.5 in the prior month. The six-month business condition outlook dropped to 21.8 in March from 31.3 in the prior month. We’ll be looking for improvements in all of these components to certify that manufacturing green shoots are turning into bamboo stalks.
Thursday will also bring with it the latest Leading Economic Indicator results. The week will conclude without trading Friday, but with the release of Housing Starts and Building Permits data.
It should be noted that much of the equity market rise has been predicated upon a belief that the U.S. returning to trend growth correlates and coincides with a rebound in China’s economic activity. On Friday, Exports jumped 14.2% in March from a year earlier while imports fell 7.6% in dollar terms, the customs administration said Friday. That left a trade surplus of $32.65 billion, with the bilateral surplus with the U.S. rising to $20.5 billion in the month from $14.7 billion in February.
Fund Flows, Still Stink
Year-to-date through the Lipper fund-flows week ended April 10, 2019, equity funds (including ETFs) handed back some $2.8 billion despite the average equity fund posting a 14.94% return.
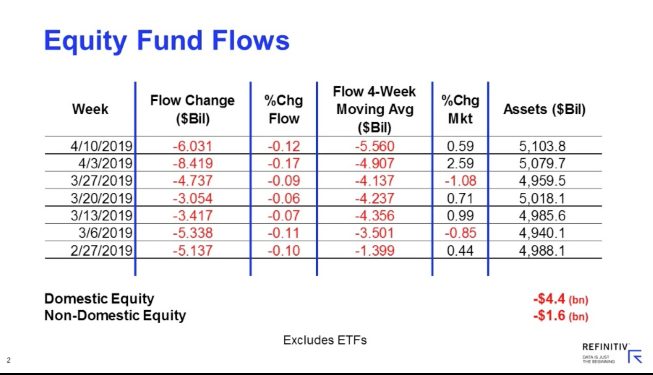
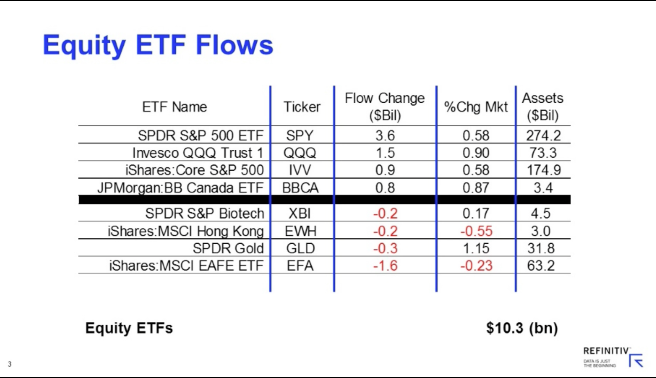
As shown in the screenshot above, equity fund flows continue to be negative, with outflows continuing last week, but for the 2nd consecutive week equity, ETFs saw inflows. (See table below)
When reviewing the Investment Company Institute (ICI) fund flow data we can more easily see that as capital is flowing out of equities it is flowing into fixed income funds. (Table from Bespoke Investment Group)
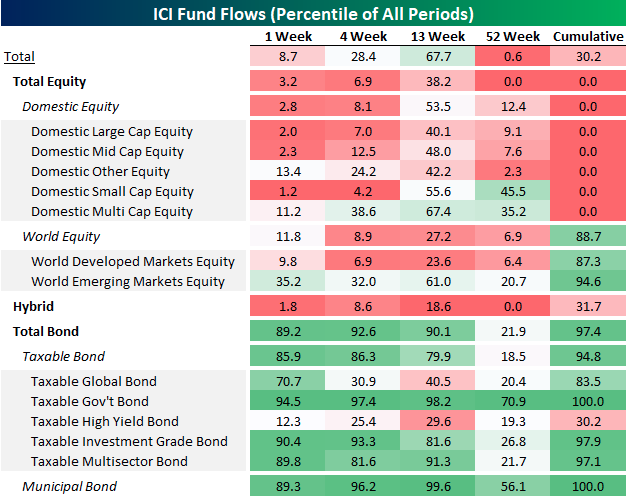
Despite negativity exhibited by equity mutual fund flows, the bond space has been thriving of late, with inflows to total bond funds better than 90% of all periods in the last three months, driven by taxable government bonds and municipal bonds. The most recent week saw very strong inflows to bond funds generally, mostly led by taxable government bonds but with a strong showing from investment grade credit, multi-sector bonds and municipal bonds.
While equity ETF flows are showing some signs of a reversal from outflows to inflows of late, we’ll need to see a greater shift over the course of Q2 to suggest equity ETF flows are “improved”. When looking at the sentiment surveys and indicators, I think these late equity ETF inflows are just that, “Johnny come lately” and contrarian in nature. I’d be happy to be proven wrong nonetheless.
S&P 500 Earnings Recession
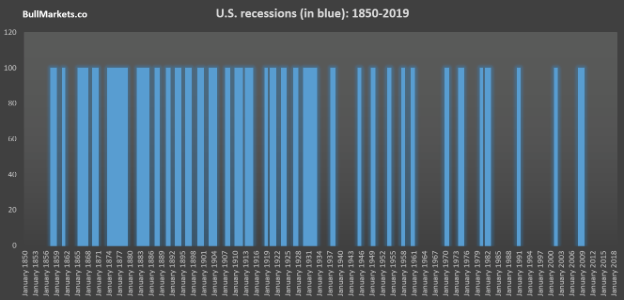
It’s an ugly title, right; S&P 500 Earnings Recession? That may be so, but as far as the economy is concerned, it is further distancing itself from the former fears of a near term recession. Most economists and firms have steadily increased their GDP forecast throughout the Q1 period. And in just 2 short months, this will officially be the longest economic expansion in U.S. history. Economic expansions have lasted longer and longer since the Great Depression. (Bar chart from Troy Bombardia)
In previous reporting, I’ve mentioned that the conditions for a recession are not present in the economy. Some of the components that we look at to define and validate this claim are as follows:
- Job gains for 102 months in a row, longest run in history (by over 2x).
- Unemployment Rate at 3.8%, near lowest level in last 50 yrs.
- Initial Claims and 4-week average at lowest level since 1969.
- Consumer spending above 3% annual rate
- PCE below 2%
- 30-year fixed mortgage rate nearly 4%
- New Home sales at 11-year high levels.
- Household debt-to-income ratio at best levels in decades
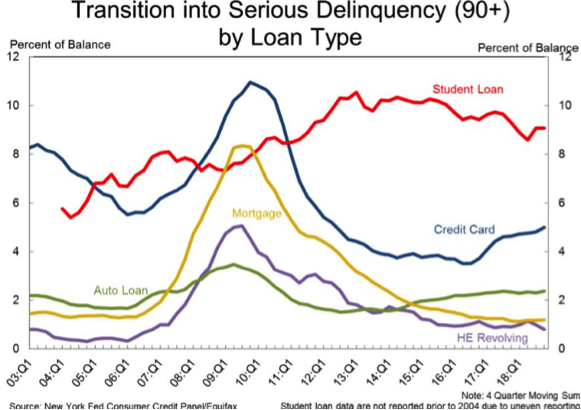
- Delinquency rates at low levels across most credit categories.
I could literally go on-and-on and tout various economic indicators and sentiment figures associated with a strong economy that won’t likely produce a recession in 2019. To add a more authoritative scope of why the current expansion cycle has disproven the naysayers and dispensed with the notion that expansion cycles have expiration dates, let’s take a look at what Bill McBride has to say about it.

“The current U.S. expansion is currently the second longest on record, and it seems extremely likely that the current expansion will surpass the '90s expansion in a few months.
As I noted in late 2017 in Is a Recession Imminent? (One of the five questions I'm frequently asked)
Expansions don't die of old age! There is a very good chance this will become the longest expansion in history.
A key reason the current expansion has been so long is that housing didn't contribute for the first few years of the expansion. Also the housing recovery was sluggish for a few more years after the bottom in 2011. This was because of the huge overhang of foreclosed properties coming on the market. Single family housing starts and new home sales both bottomed in 2011 - so this is just the eight year of housing expansion - and I expect further increases in starts and sales over the next year or longer.”
Furthermore, with mortgage rates at their lowest level in nearly 14 months, it serves to figure that the improving housing sector data may have legs to further propel the economy in 2019. Remember, the housing sector has what we commonly refer to as the “pile on” effect. When you buy a house, you often buy a great deal of furnishings and goods to go into that house!
I don’t dismiss the stimulus still pumping into the global economy whether it be active stimulus via the PBOC/China or the passive stimulus with central banks halting further rate hikes in the calendar year. This is actually the backdrop or glide path from above-trend growth that found the FOMC over tightening and quickly realizing the affects of such measures in late December 2018. Essentially, there is no real methodology for forecasting when the central bank would have proven to have over tightened without actually over tightening. And now for the Q1 2019 S&P 500 earnings outlook…
S&P 500 Earnings Outlook
Earnings estimates tracked across a multitude of firms continue to come down week-to-week. FactSet’s latest S&P 500 EPS forecast for and tracking for Q1 are displayed in the following:
- Earnings Growth: For Q1 2019, the blended earnings decline for the S&P 500 is -4.3%. If -4.3% is the actual decline for the quarter, it will mark the first year-over-year decline in earnings for the index since Q2 2016 (-3.2%).
- Earnings Revisions: On March 31, the estimated earnings decline for Q1 2019 was -4.1%. Five sectors have lower growth rates today (compared to March 31) due to downward revisions to EPS estimates and negative EPS surprises.
- Earnings Guidance: For Q2 2019, 4 S&P 500 companies have issued negative EPS guidance and 1 S&P 500 Company has issued positive EPS guidance.
- Valuation: The forward 12-month P/E ratio for the S&P 500 is 16.7. This P/E ratio is above the 5-year average (16.4) and above the 10-year average (14.7).
- Earnings revisions have slowed with FactSet reducing their EPS estimate by .1% from a week ago.
- The blended (combines actual results for companies that have reported and estimated results for companies that have yet to report) earnings decline for the first quarter is -4.3% today, which is slightly smaller than the earnings decline of -4.5% last week. Positive earnings surprises reported by companies in the Financials sector were mainly responsible for the slight decrease in the overall earnings decline during the week.
- The blended revenue growth rate for Q1 2019 is 4.8% today, which is slightly above the revenue growth rate of 4.6% last week. Positive revenue surprises reported by companies in the Financials sector and upward revisions to revenue estimates for companies in the Energy sector were mainly responsible for the small increase in the overall revenue growth rate during the week.
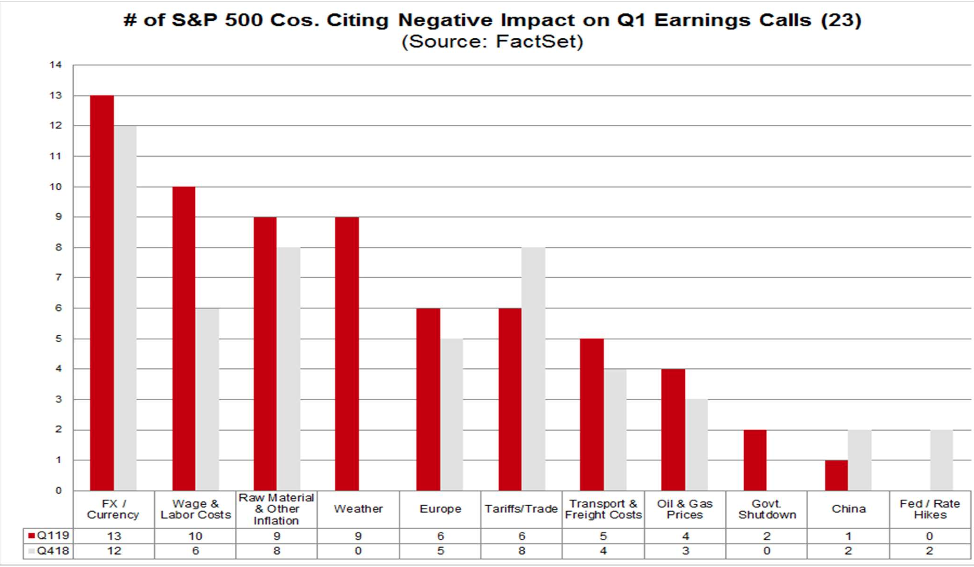
Some of the more pressing issues discussed by reporting firms already have been the strong U.S. Dollar and wages. Also of notable recognition has been the Q1 weather.
- For Q2 2019, analysts are projecting a decline in earnings of -0.4% and revenue growth of 4.2%.
- For Q3 2019, analysts are projecting earnings growth of 1.4% and revenue growth of 4.1%.
- For Q4 2019, analysts are projecting earnings growth of 8.3% and revenue growth of 4.7%.
- For CY 2019, analysts are projecting earnings growth of 3.4% and revenue growth of 4.6%.
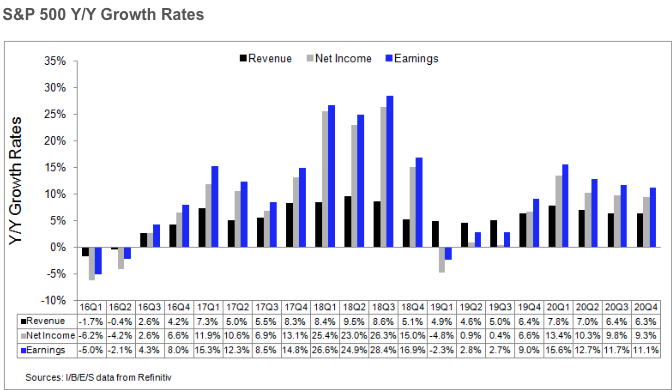
Now let’s take a look at the latest S&P 500 Q1 EPS estimates and more from Reuters/Lipper, which have also been revised lower on a week-to-week basis.
Aggregate Estimates and Revisions
- First quarter earnings are expected to decrease 2.3% from 18Q1. Excluding the energy sector, the earnings growth estimate is -1.3%.
- Of the 29 companies in the S&P 500 that have reported earnings to date for 19Q1, 79.3% have reported earnings above analyst expectations. This compares to a long-term average of 65% and prior four-quarter average of 76%.
- 19Q1 quarter revenue is expected to increase 4.9% from 18Q1. Excluding the energy sector, the revenue growth estimate is 5.5%.
- 48.3% of companies have reported 19Q1 revenue above analyst expectations. This compares to a long-term average of 60% and an average over the past four quarters of 67%.
- For 19Q1, there have been 85 negative EPS preannouncements issued by S&P 500 corporations compared to 31 positive, which results in an N/P ratio of 1.7 for the index.
- The forward four-quarter (19Q2 – 20Q1) P/E ratio for the S&P 500 is 16.8.
- During the week of Apr. 15, 50 S&P 500 companies are expected to report quarterly earnings.
Below is a screenshot from Earnings Whisper displaying the key earnings reports to be delivered this coming week.
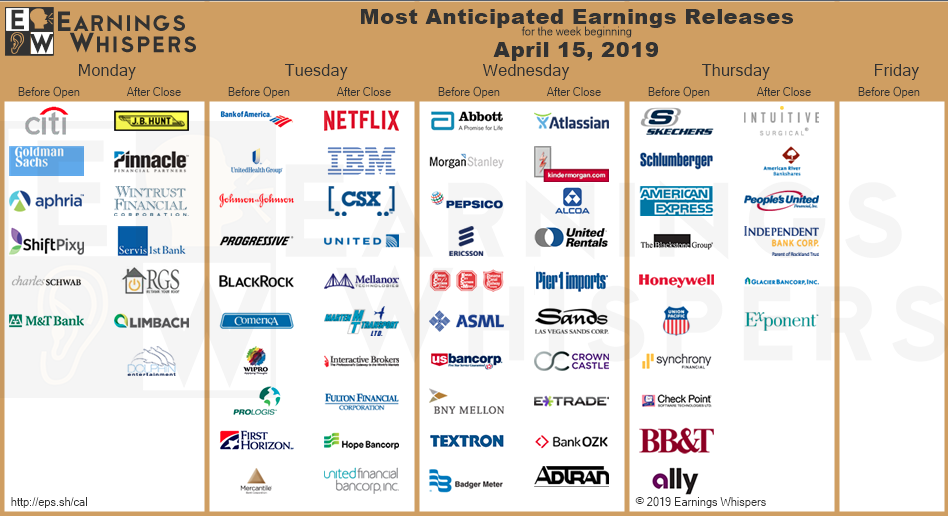
Monday will find earnings reports from the likes of Citigroup (C) and Goldman Sachs (GS). With earnings continuing to be delivered from the financial sector (XLF), investors will also receive Q1 results from outside of the sector and from the likes of Netflix, CSX Corp. (CSX), IBM (IBM) and PepsiCo (PEP).
Bogus Claim of the Week
As we often aim to deliver the facts and remove hyperbole from the investor dialogue in favor of said facts, our latest bogus claim of the week comes directly from Clarity Financials Lance Roberts. In his latest blog post titled “Make Stock Buybacks Illegal?, the often hyperbolic Roberts offers the following to readers/investors:
“The other problem with the share repurchases is that is has increasingly been done with the use of leverage. The ongoing suppression of interest rates by the Federal Reserve led to an explosion of debt issued by corporations. Much of the debt was not used for mergers, acquisitions or capital expenditures but for the funding of share repurchases and dividend issuance.”
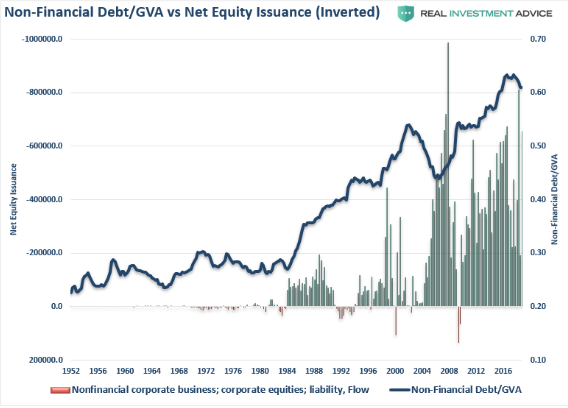
Make buybacks illegal, with a question mark and highlighting the issue of buybacks with an inverted chart… that’s the Roberts way. It aims to muddle the commentary. But make no mistake about it; the claim that increasing leverage/debt is being used to transact buybacks is a farce and stretching the relative time value of the equation, which has proven mostly consistent since the turn of the century.

As shown in the chart above from JPM, funding buybacks with debt has been stagnant since 2012 and actually rolled over in 2018. This was a byproduct of the tax reform legislation that found corporates repatriating more cash, thus shifting the source of funding for buybacks in even greater favor of cash from debt. But also and more importantly, buybacks have always been a vast majority cash oriented exercise by corporations and debt vs. cash generated buyback ratio almost never changes, as shown in the chart.
Investor Takeaways
Every week is seemingly a critical week for the market when the market is expressing a V-shaped recovery. With an earnings recession in the Q1 period already expected and priced into the market, guidance will prove critical to sustain the market’s rebound. If guidance and actual Q1 results prove less than already priced in to the market, bouts of selling may find a pullback in the near future with bouts of volatility.
This coming week also marks a VIX futures expiration week come Tuesday. The front end of the VIX futures term structure is very steep presently, with a build-up of contango suppressing VIX-ETP prices. With the VIX dipping below 12 last week, there is still decay and selling of the April futures contracts that needs to occur in order to exercise contracts at expiration, while converging price onto spot VIX. (See chart below)
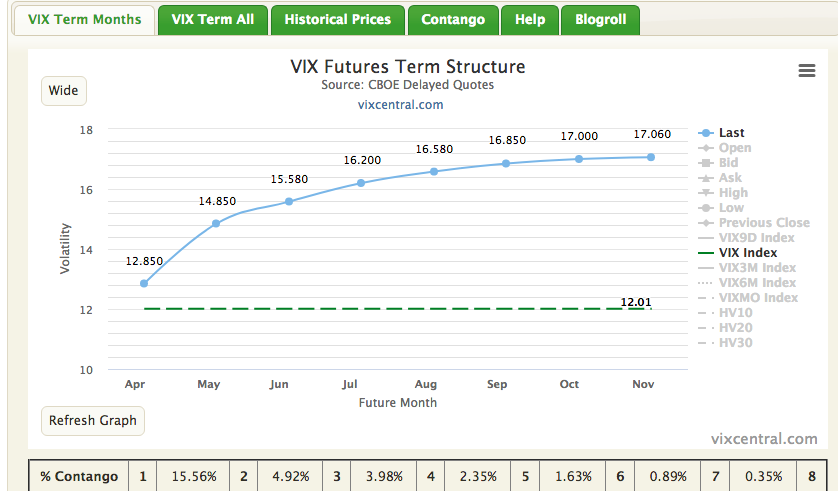
Given the steepness of the curve and VIX futures expiration on Tuesday, the short-VOL positioning is still advantaged. Of course, based on the VIX calendar that suggests new hedges will be placed at the start of the trading week, some of the roll yield expressed in futures term structure can be mitigated and assuming this takes place on scale come Monday.
For active portfolio managers, the present risk/reward for market bulls is characterized as leaning bearish near-term, with the probability of a market pullback increasing and coinciding with bouts of increased volatility. While we can’t predict how earnings season will move markets, we do believe there is an above average probability that estimates have come down too far and express excessive caution on the quarter.
The market always delivers opportunity, but the opportunity can often only be realized through the preparedness of a portfolio. This begs the questions: Are you positioned to take advantage of opportunity when it is presented? Do you have cash and/or liquidity? Are you prepared to ride out potential market storms/turmoil?


