Market Scenarios
The four market scenarios below provide a framework for prudent contingency planning:
-
ONE: Low is in and stocks continue to rise rapidly.
-
TWO: The market will remain in a wide trading range.
-
THREE: A typical retest of the March 23 low is coming soon.
-
FOUR: An atypical retest with a significantly lower low lies ahead.
Unless you believe you can predict the future with 100% certainty (something we all know is not possible), it is prudent to have a mixed allocation currently that allows you a migration path to handle all four scenarios.
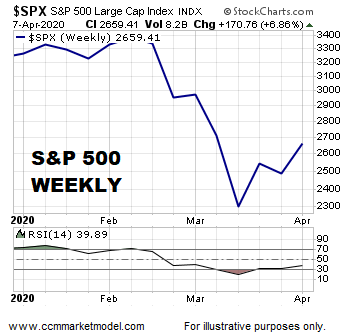
Historically, significant declines are typically (not always) followed by a retest of the prior low. We just experienced a rare and significant decline that was accompanied by a weekly RSI close below 22.
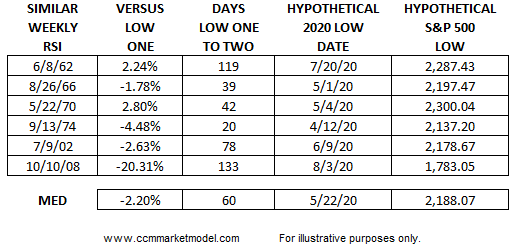
To provide a scenario-specific framework walking forward, we found every case when weekly RSI dropped below 22 since the S&P 500’s inception in 1957. In the six historical cases, the median rally following low one was 14%. All six cases featured some type of retest after the sharp post-low-one rally. The table below provides a summary of the most relevant points. The median outcome was a retest of low one that dropped 2.20% below low one. The second column shows two of the six historical cases made a higher low relative to low one. Low one is the initial “high fear low” and low two is the retest low or “lower fear low”.
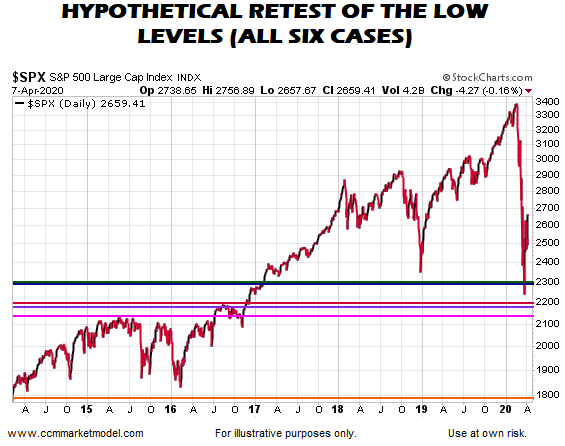
Putting the results on hypothetical 2020 graphs helps highlight the main takeaways. In the graph below, the horizontal lines show hypothetical retest lows based on five of the six historical weekly RSI cases. While it may sound counter intuitive since we have some exposure to stock ETFs, the best case scenario is for the market to drop significantly again and make a stand somewhere near the areas denoted by the horizontal lines, allowing us to redeploy cash at lower prices. Having some exposure to stocks prior to a retest also increases the odds we can get close to fully invested near the retest low. Moving from 100% cash to 100% invested near the retest low is a difficult risk-management and psychological proposition. Sitting in 100% cash today also makes it nearly impossible to effectively deal with scenario one described in the opening paragraph.
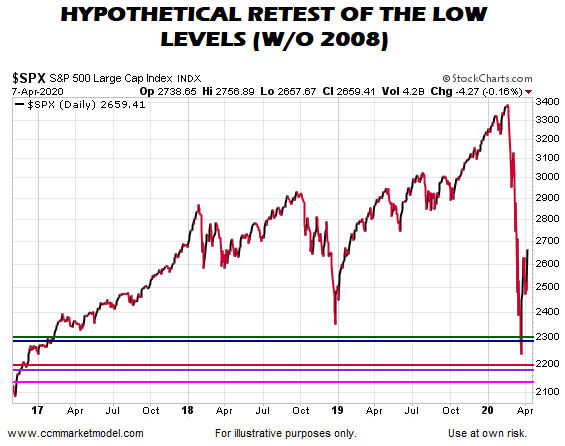
The graph below includes the 2008 case. If stocks drop back toward the prior low and we are unable to check the “we expect to see this on a successful retest” boxes, then we must be prepared to account for a significantly lower low relative to the March 23, 2020 low. As noted on April 6, recent market action has reduced (not eliminated) the odds of a sustained drop significantly below 2,100 on the S&P 500.
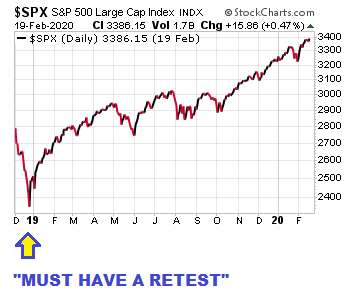
THERE IS NO MARKET LAW REQUIRING A RETEST OF A LOW
It is easy to say “the market has to retest the low”. The same argument was made during the entire calendar year 2019. Contingency plans must account for even lower probability scenarios. The probability of the “no retest” outcome is never zero.
PLANNING SEVERAL MOVES IN ADVANCE
Decisions that we make in the present day must consider all four major market scenarios and they must do so in the context of the longer-term goal, which is to remain in step with the market’s primary trend. It is very easy in the current environment to get hyper-focused on our account balance intraday. It is helpful to think about your entire portfolio when the market is dropping, rather than focusing on the daily decline in a few positions. If you have 10% exposure to the stock market and the market drops 10%, the impact on your account is only 1%. The table below can assist with thinking about your whole portfolio during high volatility periods.

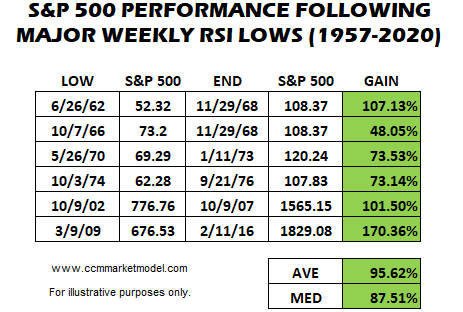
Our goal is not to minimize intraday fluctuations. Our ultimate goal is to get to the other side of this event. The reward for those who remained focused on the ultimate goal in the six similar oversold RSI cases was outstanding. The table below shows S&P 500 performance following the six similar weekly RSI cases discussed above. Our timeframe is not the next two trading hours, the next two weeks, nor the next two months. The table below helps us to keep “the other side” in mind during periods of high volatility and stress.