
Market Hovering Near Important Guideposts
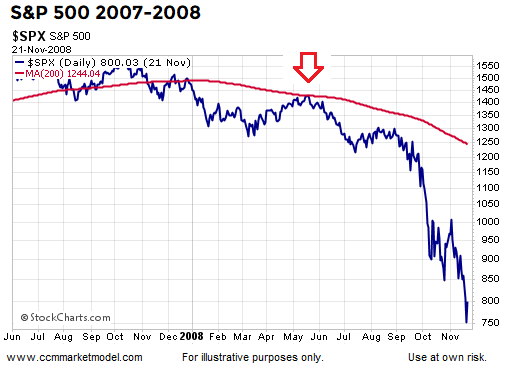
2008 CASE
As shown in the 2008 case below, it is not uncommon for markets to come back and test the 200-day moving average during a bear market.
(Click on image to enlarge)
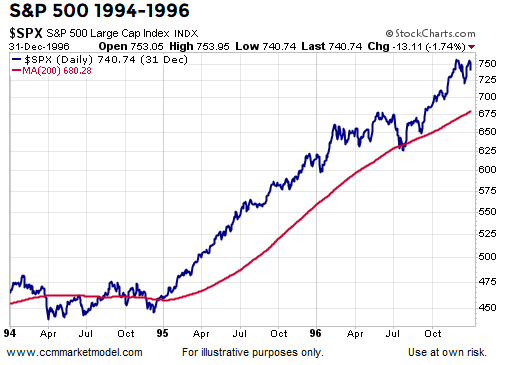
HEALTHY MARKETS
Healthy and sustainable long-term trends tend to feature a high percentage of trading days that close above the 200-day (example below). Thus, the longer a market can stay above the 200-day in the early stages of a rally attempt, the higher the odds we are dealing with a new trend rather than a countertrend move that will be followed by lower lows.
(Click on image to enlarge)
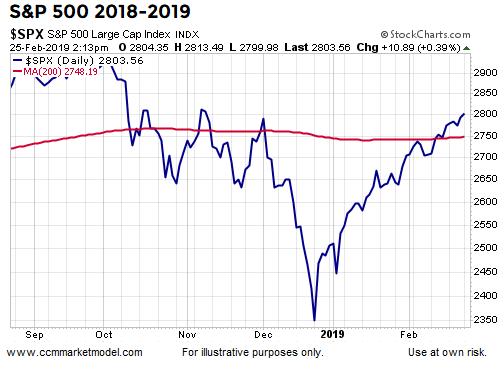
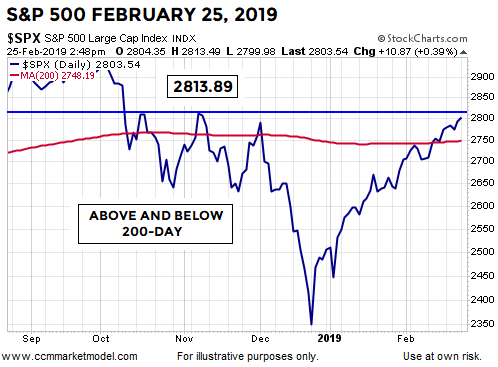
2019 CASE
The S&P 500 dropped 19% between the September high and the December low. Monday’s session was the S&P 500’s ninth consecutive close above the 200-day moving average.
(Click on image to enlarge)
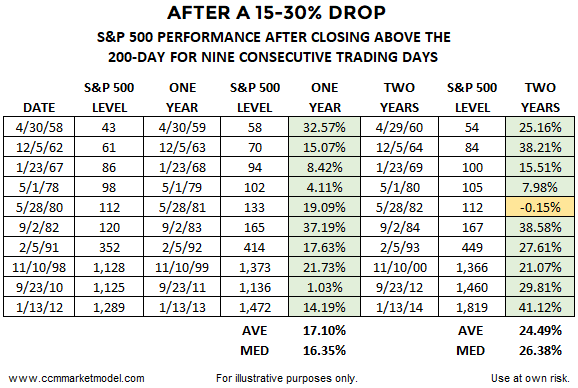
SIMILAR CASES
Dating back to 1950, if we look for S&P 500 cases that featured a 15-30% drop, followed by a push back above the 200-day, how did the market perform after closing above the 200-day for nine consecutive sessions? The answer is, from a longer-term historical perspective, quite well.
(Click on image to enlarge)
POSSIBLE PLUNGE RESISTANCE
In 2019, the S&P 500 has rallied back to an area that may offer some resistance. The S&P 500 closed at 2,813.89 on November 7, 2018. Monday’s intraday high was 2,813.49. There is nothing magical about 2,813; just as there is nothing magical about the 200-day moving average. They are simply reference points. On the way down, price moved above and below the 200-day but had trouble holding above 2,813, which means this area may be relevant on the way back up.
(Click on image to enlarge)
A DIFFERENT PERSPECTIVE
This week’s stock market video highlights a rare dual setup involving Bollinger Bands and market breadth.
MEASURED APPROACH
There are numerous reasons to be optimistic about stocks. Over the past few weeks, we have seen noticeable improvement in the hard data tracked by the market model, including higher trend strength (TS) scores. However, the data, scores, and possible overhead resistance continue to align with a prudent and measured approach; something that is reflected in our portfolio mix. The longer the S&P 500 can hold above the 200-day, the more relevant it becomes. A sustained break above the S&P 500’s November 7, 2018 close (2,813.89) would also eliminate some short-term concerns.
Disclaimer: The opinions in this document are for informational and educational purposes only and should not be construed as a recommendation to buy or sell the stocks mentioned or to solicit ...
more

