
Market Cap Of U.S. New Homes Nears Correction
If you saw the news headlines earlier this week, you already know that new home sales in the U.S. showed signs of a rebound in March 2019. If that preliminary indication holds through the next several months of revisions, that rebound is coming at a good time because the new home market in the U.S. has been on the verge of a correction.
That assessment is based on the trailing twelve month average of the market capitalization of new home sales in the U.S., which initially appears to have bottomed in February/March 2019 after having peaked in March 2018. Since then, the estimated market cap of new homes in the U.S. has fallen by roughly 9%.
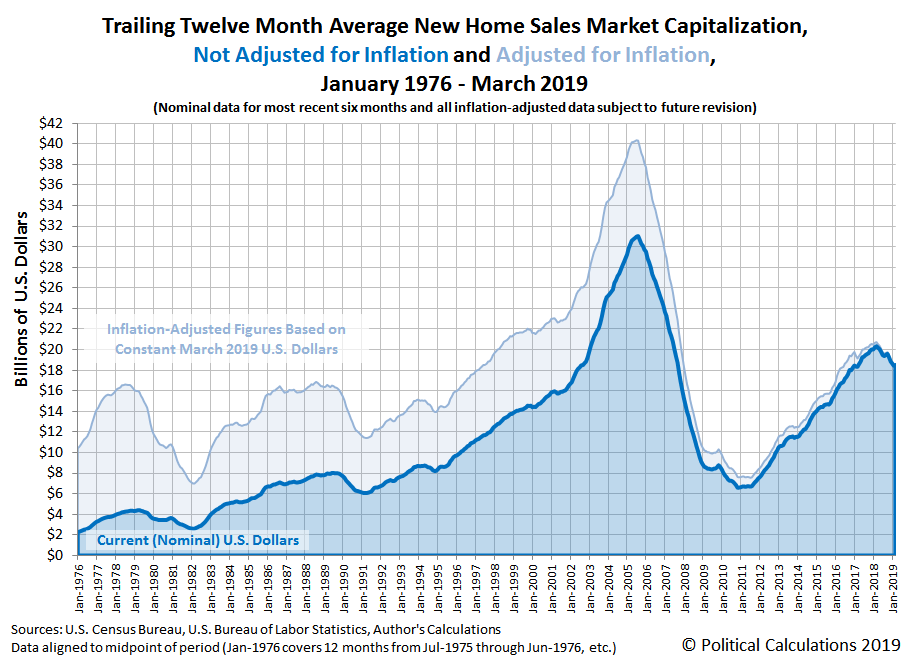
After adjusting for inflation to put the estimate market cap figures into terms of constant March 2019 U.S. dollars, the results of the math get slightly worse, with the magnitude of the decline crossing the correction threshold with a little over a 10% decline.
The results of those year-over-year comparisons are a bit easier to see in the next chart, where we've calculated the year-over-year growth rate of the U.S. new home market cap.

The bad news is the growth rate of the new home market cap is the most negative it has been since the first U.S. housing bubble began to deflate. The good news is that recent descent slowed in March 2019. We're in for several months of data updates and revisions before we can definitively determine if the new home market has really hit bottom.
References
U.S. Census Bureau. New Residential Sales Historical Data. Houses Sold. [Excel Spreadsheet]. Accessed 24 April 2019.
U.S. Census Bureau. New Residential Sales Historical Data. Median and Average Sale Price of Houses Sold. [Excel Spreadsheet]. Accessed 24 April 2019.
U.S. Department of Labor Bureau of Labor Statistics. Consumer Price Index, All Urban Consumers - (CPI-U), U.S. City Average, All Items, 1982-84=100 [PDF Document]. Accessed 10 April 2019.
Disclaimer: Materials that are published by Political Calculations can provide visitors with free information and insights regarding the incentives created by the laws and policies described. ...
more

